
TRAFIGURA BUSINESS MODEL CANVAS TEMPLATE RESEARCH

Trafigura Business Model Canvas: Logistics, Margins & Asset-Light Scale-Download Now
Unlock the full strategic blueprint behind Trafigura's business model-this concise Business Model Canvas exposes how the trader leverages logistics, trading margins, and asset-light operations to scale globally, manage risk, and capture market share.
Perfect for investors, consultants, and founders, the downloadable Canvas (Word & Excel) gives you all nine blocks with actionable insights and financial implications-grab it to benchmark strategy and accelerate decision-making.
Partnerships

150 Plus Global Banking Institutions
Trafigura secures liquidity via a revolving credit facility backed by 150+ global banks, supporting roughly $20-25 billion of committed lines in FY2025 to fund multi‑billion dollar cargoes and margin calls.
National Oil Companies and Sovereign Entities
Trafigura acts as a bridge for national oil companies, securing long-term supply deals-e.g., 2025 volumes from sovereign partners tied to ~45 million tonnes of oil product flows-while supplying technical know-how and logistics these states often lack.

H2 Energy Europe and Green Hydrogen Ventures
Trafigura partners with H2 Energy and Green Hydrogen Ventures to build European green-hydrogen supply chains, targeting 500+ MW electrolysis capacity and €1.2 billion invested by FY2025 to develop production and refueling hubs, shifting capital from oil trading toward hydrogen as a primary zero-carbon energy carrier.

Nyrstar and Strategic Mining Affiliates
Trafigura holds majority stakes in industrial partners such as Nyrstar (zinc/lead), enabling end-to-end control from mine to smelter and boosting quality and supply security; in 2025 Nyrstar processed ~1.1 Mt of zinc concentrates and Trafigura-linked assets contributed to a metals inventory of roughly $6.4bn.
- Vertical control: majority stakes in Nyrstar
- 2025 throughput: ~1.1 Mt zinc concentrates
- Metals inventory (2025): ≈ $6.4bn
- Competitive edge: supply-chain certainty, quality consistency
Global Shipping and Logistics Syndicates
Trafigura partners with shipowners, port authorities, and freight operators to manage a fleet of roughly 400-600 chartered vessels, moving millions of tonnes annually and executing ~6,000 voyages per year to cut transit times and emissions.
- Fleet size: ~400-600 chartered vessels
- Annual voyages: ~6,000
- Annual volumes: millions of tonnes
- Focus: lower transit time and carbon intensity via efficient fleet management
Trafigura: $20-25bn lines, $6.4bn metals, 1.1Mt zinc, 400-600 ships, €1.2bn hydrogen
Trafigura secures $20-25bn committed bank lines (150+ banks) in FY2025, controls ~1.1Mt zinc throughput via Nyrstar with metals inventory ≈ $6.4bn, and operates ~400-600 chartered vessels executing ~6,000 voyages annually while committing €1.2bn to 500+MW green hydrogen projects.
| Partnership | 2025 Key Number |
|---|---|
| Bank lines | $20-25bn (150+ banks) |
| Nyrstar throughput | ~1.1Mt zinc concentrates |
| Metals inventory | ≈ $6.4bn |
| Fleet | 400-600 vessels, ~6,000 voyages |
| Hydrogen investment | €1.2bn, 500+ MW |
What is included in the product
 Detailed Word Document
A concise Business Model Canvas for Trafigura mapping nine blocks-customer segments, value propositions, channels, customer relationships, revenue streams, key resources, key activities, key partnerships, and cost structure-based on its global commodities trading, logistics, and storage operations.

 Customizable Excel Spreadsheet
High-level view of Trafigura's business model with editable cells to pinpoint trading flows, asset-light logistics, and margin drivers.
Activities

Physical Commodity Sourcing and Origination
Trafigura sources oil, metals, and minerals directly across 40+ producing countries, buying roughly $160 billion of commodities in FY2025 to secure export flows from politically complex regions.
This requires deep local teams, fast logistics and a compliance program that supported $3.8 billion in risk provisions and KYC/AML controls in 2025 to manage producer and geopolitical risks.
Global Logistics and Supply Chain Management
Trafigura moves over 300 million tonnes of commodities annually (2025), using sea, rail, and road fleets while operating ~160 storage and blending terminals worldwide; revenue-linked logistics fees contributed roughly $4.2 billion in 2025, ensuring timely delivery and grade-spec transformations for global energy and metals markets.

Advanced Risk Management and Hedging
Trafigura uses derivatives and dynamic hedges to protect margins; in 2025 it reported trading gains offsetting mark-to-market swings with risk exposures managed across $32 billion of commodity inventories and over $18 billion notional in hedges.

Strategic Asset Investment and Optimization
Trafigura invests in ports, warehouses, and plants to control supply routes; as of FY2025 it reportedly operates assets handling ~420 million tonnes/year, boosting margin capture and service reliability.
Optimizing these "pipes" lifts utilization rates-Trafigura targeted >85% asset uptime in 2025-unlocking ancillary fees and steadier logistics for global clients.
- 420 million tonnes/year capacity (FY2025)
- >85% targeted asset uptime (2025)
- Higher margin capture via asset-based logistics
Energy Transition and Carbon Management
Trafigura now dedicates significant capital to decarbonization-trading carbon credits, funding renewable projects, and building supply chains for transition metals (copper, lithium); in 2025 Trafigura committed about $3.5bn to energy transition assets and targets a 30% increase in renewables-linked volumes versus 2023.
- Committed energy-transition capital: $3.5bn (2025)
- Renewables-linked volume growth target: +30% vs 2023
- Active in carbon credit markets and copper/lithium supply chains
Trafigura 2025: $160B commodities, $32B inventories, $3.5B energy transition
Trafigura sources $160bn of commodities (FY2025), moves 300-420mtpa via 160 terminals, held $32bn inventories and $18bn hedges, recorded $4.2bn logistics fees, $3.8bn risk provisions, and committed $3.5bn to energy transition (2025).
| Metric | FY2025 |
|---|---|
| Commodity purchases | $160bn |
| Throughput | 300-420mt |
| Inventories | $32bn |
| Hedges (notional) | $18bn |
| Logistics fees | $4.2bn |
| Risk provisions | $3.8bn |
| Energy transition capex | $3.5bn |
What You See Is What You Get
Business Model Canvas
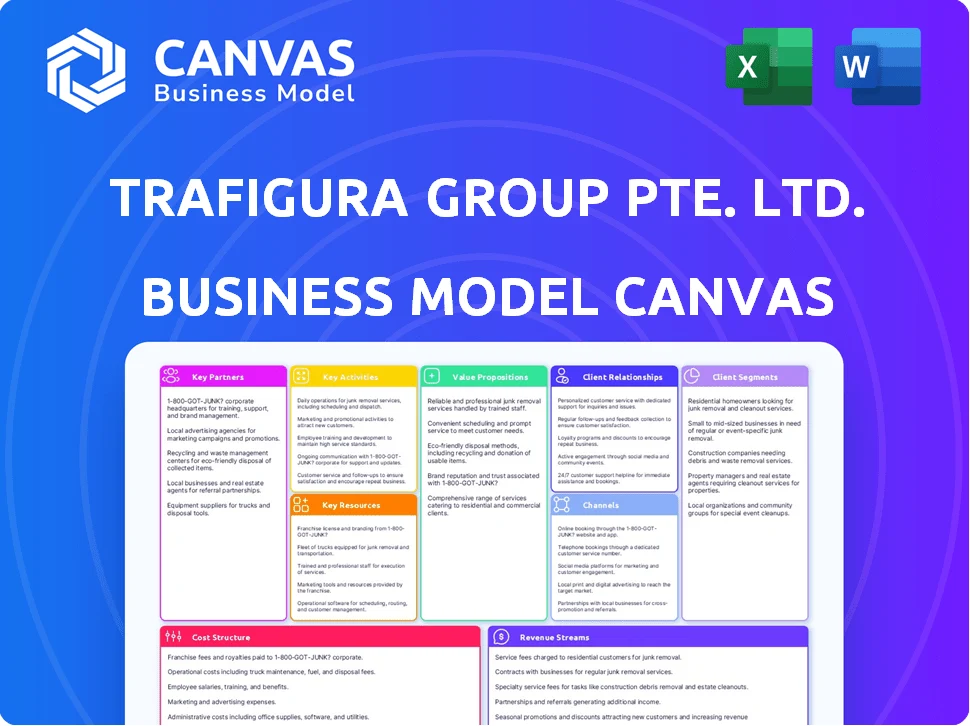
The Trafigura Business Model Canvas shown here is the actual deliverable, not a mockup-it's a direct snapshot of the file you'll receive after purchase.
When you complete your order, you'll get this same professional, fully editable document ready for use in Word and Excel formats.
No placeholders or marketing samples-what you see is the complete format and content you'll download and apply immediately.

TRAFIGURA BUSINESS MODEL CANVAS TEMPLATE RESEARCH
Trafigura Business Model Canvas: Logistics, Margins & Asset-Light Scale-Download Now
Unlock the full strategic blueprint behind Trafigura's business model-this concise Business Model Canvas exposes how the trader leverages logistics, trading margins, and asset-light operations to scale globally, manage risk, and capture market share.
Perfect for investors, consultants, and founders, the downloadable Canvas (Word & Excel) gives you all nine blocks with actionable insights and financial implications-grab it to benchmark strategy and accelerate decision-making.
Partnerships
150 Plus Global Banking Institutions
Trafigura secures liquidity via a revolving credit facility backed by 150+ global banks, supporting roughly $20-25 billion of committed lines in FY2025 to fund multi‑billion dollar cargoes and margin calls.
National Oil Companies and Sovereign Entities
Trafigura acts as a bridge for national oil companies, securing long-term supply deals-e.g., 2025 volumes from sovereign partners tied to ~45 million tonnes of oil product flows-while supplying technical know-how and logistics these states often lack.
H2 Energy Europe and Green Hydrogen Ventures
Trafigura partners with H2 Energy and Green Hydrogen Ventures to build European green-hydrogen supply chains, targeting 500+ MW electrolysis capacity and €1.2 billion invested by FY2025 to develop production and refueling hubs, shifting capital from oil trading toward hydrogen as a primary zero-carbon energy carrier.
Nyrstar and Strategic Mining Affiliates
Trafigura holds majority stakes in industrial partners such as Nyrstar (zinc/lead), enabling end-to-end control from mine to smelter and boosting quality and supply security; in 2025 Nyrstar processed ~1.1 Mt of zinc concentrates and Trafigura-linked assets contributed to a metals inventory of roughly $6.4bn.
- Vertical control: majority stakes in Nyrstar
- 2025 throughput: ~1.1 Mt zinc concentrates
- Metals inventory (2025): ≈ $6.4bn
- Competitive edge: supply-chain certainty, quality consistency
Global Shipping and Logistics Syndicates
Trafigura partners with shipowners, port authorities, and freight operators to manage a fleet of roughly 400-600 chartered vessels, moving millions of tonnes annually and executing ~6,000 voyages per year to cut transit times and emissions.
- Fleet size: ~400-600 chartered vessels
- Annual voyages: ~6,000
- Annual volumes: millions of tonnes
- Focus: lower transit time and carbon intensity via efficient fleet management
Trafigura: $20-25bn lines, $6.4bn metals, 1.1Mt zinc, 400-600 ships, €1.2bn hydrogen
Trafigura secures $20-25bn committed bank lines (150+ banks) in FY2025, controls ~1.1Mt zinc throughput via Nyrstar with metals inventory ≈ $6.4bn, and operates ~400-600 chartered vessels executing ~6,000 voyages annually while committing €1.2bn to 500+MW green hydrogen projects.
| Partnership | 2025 Key Number |
|---|---|
| Bank lines | $20-25bn (150+ banks) |
| Nyrstar throughput | ~1.1Mt zinc concentrates |
| Metals inventory | ≈ $6.4bn |
| Fleet | 400-600 vessels, ~6,000 voyages |
| Hydrogen investment | €1.2bn, 500+ MW |
What is included in the product
Detailed Word Document
A concise Business Model Canvas for Trafigura mapping nine blocks-customer segments, value propositions, channels, customer relationships, revenue streams, key resources, key activities, key partnerships, and cost structure-based on its global commodities trading, logistics, and storage operations.
Customizable Excel Spreadsheet
High-level view of Trafigura's business model with editable cells to pinpoint trading flows, asset-light logistics, and margin drivers.
Activities
Physical Commodity Sourcing and Origination
Trafigura sources oil, metals, and minerals directly across 40+ producing countries, buying roughly $160 billion of commodities in FY2025 to secure export flows from politically complex regions.
This requires deep local teams, fast logistics and a compliance program that supported $3.8 billion in risk provisions and KYC/AML controls in 2025 to manage producer and geopolitical risks.
Global Logistics and Supply Chain Management
Trafigura moves over 300 million tonnes of commodities annually (2025), using sea, rail, and road fleets while operating ~160 storage and blending terminals worldwide; revenue-linked logistics fees contributed roughly $4.2 billion in 2025, ensuring timely delivery and grade-spec transformations for global energy and metals markets.
Advanced Risk Management and Hedging
Trafigura uses derivatives and dynamic hedges to protect margins; in 2025 it reported trading gains offsetting mark-to-market swings with risk exposures managed across $32 billion of commodity inventories and over $18 billion notional in hedges.
Strategic Asset Investment and Optimization
Trafigura invests in ports, warehouses, and plants to control supply routes; as of FY2025 it reportedly operates assets handling ~420 million tonnes/year, boosting margin capture and service reliability.
Optimizing these "pipes" lifts utilization rates-Trafigura targeted >85% asset uptime in 2025-unlocking ancillary fees and steadier logistics for global clients.
- 420 million tonnes/year capacity (FY2025)
- >85% targeted asset uptime (2025)
- Higher margin capture via asset-based logistics
Energy Transition and Carbon Management
Trafigura now dedicates significant capital to decarbonization-trading carbon credits, funding renewable projects, and building supply chains for transition metals (copper, lithium); in 2025 Trafigura committed about $3.5bn to energy transition assets and targets a 30% increase in renewables-linked volumes versus 2023.
- Committed energy-transition capital: $3.5bn (2025)
- Renewables-linked volume growth target: +30% vs 2023
- Active in carbon credit markets and copper/lithium supply chains
Trafigura 2025: $160B commodities, $32B inventories, $3.5B energy transition
Trafigura sources $160bn of commodities (FY2025), moves 300-420mtpa via 160 terminals, held $32bn inventories and $18bn hedges, recorded $4.2bn logistics fees, $3.8bn risk provisions, and committed $3.5bn to energy transition (2025).
| Metric | FY2025 |
|---|---|
| Commodity purchases | $160bn |
| Throughput | 300-420mt |
| Inventories | $32bn |
| Hedges (notional) | $18bn |
| Logistics fees | $4.2bn |
| Risk provisions | $3.8bn |
| Energy transition capex | $3.5bn |
What You See Is What You Get
Business Model Canvas
The Trafigura Business Model Canvas shown here is the actual deliverable, not a mockup-it's a direct snapshot of the file you'll receive after purchase.
When you complete your order, you'll get this same professional, fully editable document ready for use in Word and Excel formats.
No placeholders or marketing samples-what you see is the complete format and content you'll download and apply immediately.
Product Information
Product Information
Shipping & Returns
Shipping & Returns
Description
Trafigura Business Model Canvas: Logistics, Margins & Asset-Light Scale-Download Now
Unlock the full strategic blueprint behind Trafigura's business model-this concise Business Model Canvas exposes how the trader leverages logistics, trading margins, and asset-light operations to scale globally, manage risk, and capture market share.
Perfect for investors, consultants, and founders, the downloadable Canvas (Word & Excel) gives you all nine blocks with actionable insights and financial implications-grab it to benchmark strategy and accelerate decision-making.
Partnerships
150 Plus Global Banking Institutions
Trafigura secures liquidity via a revolving credit facility backed by 150+ global banks, supporting roughly $20-25 billion of committed lines in FY2025 to fund multi‑billion dollar cargoes and margin calls.
National Oil Companies and Sovereign Entities
Trafigura acts as a bridge for national oil companies, securing long-term supply deals-e.g., 2025 volumes from sovereign partners tied to ~45 million tonnes of oil product flows-while supplying technical know-how and logistics these states often lack.
H2 Energy Europe and Green Hydrogen Ventures
Trafigura partners with H2 Energy and Green Hydrogen Ventures to build European green-hydrogen supply chains, targeting 500+ MW electrolysis capacity and €1.2 billion invested by FY2025 to develop production and refueling hubs, shifting capital from oil trading toward hydrogen as a primary zero-carbon energy carrier.
Nyrstar and Strategic Mining Affiliates
Trafigura holds majority stakes in industrial partners such as Nyrstar (zinc/lead), enabling end-to-end control from mine to smelter and boosting quality and supply security; in 2025 Nyrstar processed ~1.1 Mt of zinc concentrates and Trafigura-linked assets contributed to a metals inventory of roughly $6.4bn.
- Vertical control: majority stakes in Nyrstar
- 2025 throughput: ~1.1 Mt zinc concentrates
- Metals inventory (2025): ≈ $6.4bn
- Competitive edge: supply-chain certainty, quality consistency
Global Shipping and Logistics Syndicates
Trafigura partners with shipowners, port authorities, and freight operators to manage a fleet of roughly 400-600 chartered vessels, moving millions of tonnes annually and executing ~6,000 voyages per year to cut transit times and emissions.
- Fleet size: ~400-600 chartered vessels
- Annual voyages: ~6,000
- Annual volumes: millions of tonnes
- Focus: lower transit time and carbon intensity via efficient fleet management
Trafigura: $20-25bn lines, $6.4bn metals, 1.1Mt zinc, 400-600 ships, €1.2bn hydrogen
Trafigura secures $20-25bn committed bank lines (150+ banks) in FY2025, controls ~1.1Mt zinc throughput via Nyrstar with metals inventory ≈ $6.4bn, and operates ~400-600 chartered vessels executing ~6,000 voyages annually while committing €1.2bn to 500+MW green hydrogen projects.
| Partnership | 2025 Key Number |
|---|---|
| Bank lines | $20-25bn (150+ banks) |
| Nyrstar throughput | ~1.1Mt zinc concentrates |
| Metals inventory | ≈ $6.4bn |
| Fleet | 400-600 vessels, ~6,000 voyages |
| Hydrogen investment | €1.2bn, 500+ MW |
What is included in the product
Detailed Word Document
A concise Business Model Canvas for Trafigura mapping nine blocks-customer segments, value propositions, channels, customer relationships, revenue streams, key resources, key activities, key partnerships, and cost structure-based on its global commodities trading, logistics, and storage operations.
Customizable Excel Spreadsheet
High-level view of Trafigura's business model with editable cells to pinpoint trading flows, asset-light logistics, and margin drivers.
Activities
Physical Commodity Sourcing and Origination
Trafigura sources oil, metals, and minerals directly across 40+ producing countries, buying roughly $160 billion of commodities in FY2025 to secure export flows from politically complex regions.
This requires deep local teams, fast logistics and a compliance program that supported $3.8 billion in risk provisions and KYC/AML controls in 2025 to manage producer and geopolitical risks.
Global Logistics and Supply Chain Management
Trafigura moves over 300 million tonnes of commodities annually (2025), using sea, rail, and road fleets while operating ~160 storage and blending terminals worldwide; revenue-linked logistics fees contributed roughly $4.2 billion in 2025, ensuring timely delivery and grade-spec transformations for global energy and metals markets.
Advanced Risk Management and Hedging
Trafigura uses derivatives and dynamic hedges to protect margins; in 2025 it reported trading gains offsetting mark-to-market swings with risk exposures managed across $32 billion of commodity inventories and over $18 billion notional in hedges.
Strategic Asset Investment and Optimization
Trafigura invests in ports, warehouses, and plants to control supply routes; as of FY2025 it reportedly operates assets handling ~420 million tonnes/year, boosting margin capture and service reliability.
Optimizing these "pipes" lifts utilization rates-Trafigura targeted >85% asset uptime in 2025-unlocking ancillary fees and steadier logistics for global clients.
- 420 million tonnes/year capacity (FY2025)
- >85% targeted asset uptime (2025)
- Higher margin capture via asset-based logistics
Energy Transition and Carbon Management
Trafigura now dedicates significant capital to decarbonization-trading carbon credits, funding renewable projects, and building supply chains for transition metals (copper, lithium); in 2025 Trafigura committed about $3.5bn to energy transition assets and targets a 30% increase in renewables-linked volumes versus 2023.
- Committed energy-transition capital: $3.5bn (2025)
- Renewables-linked volume growth target: +30% vs 2023
- Active in carbon credit markets and copper/lithium supply chains
Trafigura 2025: $160B commodities, $32B inventories, $3.5B energy transition
Trafigura sources $160bn of commodities (FY2025), moves 300-420mtpa via 160 terminals, held $32bn inventories and $18bn hedges, recorded $4.2bn logistics fees, $3.8bn risk provisions, and committed $3.5bn to energy transition (2025).
| Metric | FY2025 |
|---|---|
| Commodity purchases | $160bn |
| Throughput | 300-420mt |
| Inventories | $32bn |
| Hedges (notional) | $18bn |
| Logistics fees | $4.2bn |
| Risk provisions | $3.8bn |
| Energy transition capex | $3.5bn |
What You See Is What You Get
Business Model Canvas
The Trafigura Business Model Canvas shown here is the actual deliverable, not a mockup-it's a direct snapshot of the file you'll receive after purchase.
When you complete your order, you'll get this same professional, fully editable document ready for use in Word and Excel formats.
No placeholders or marketing samples-what you see is the complete format and content you'll download and apply immediately.


