
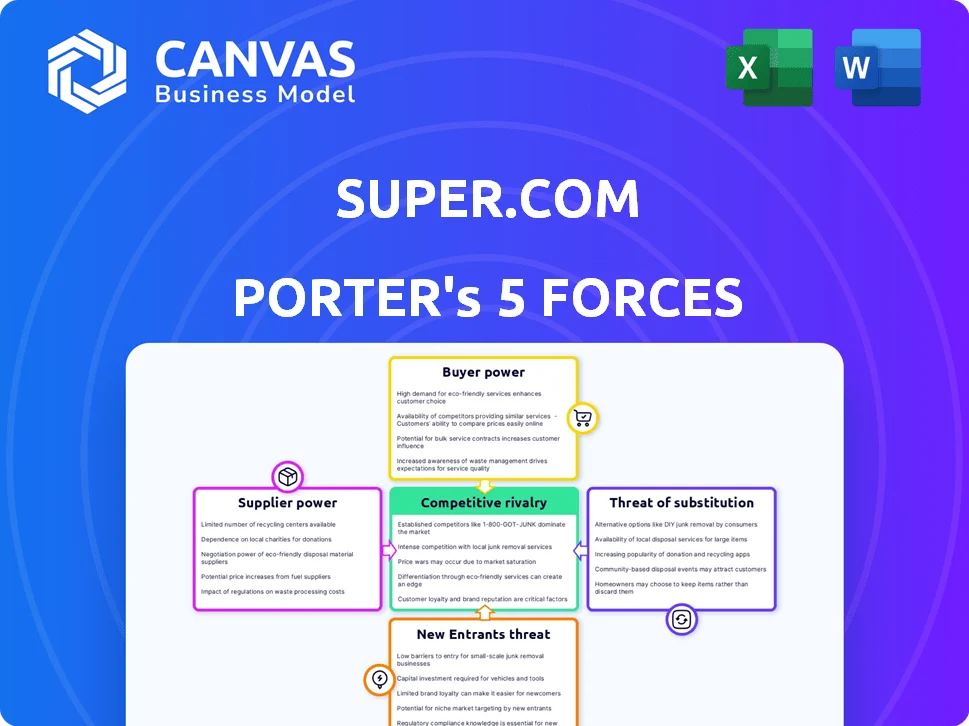
SUPER.COM PORTER'S FIVE FORCES TEMPLATE RESEARCH

Don't Miss the Bigger Picture
Super.com operates in a competitive fintech/commerce space where buyer price sensitivity, platform substitutes, and regulatory shifts compress margins but scale and proprietary data give it strategic leverage; this snapshot highlights key tensions and short-term risks. Unlock the full Porter's Five Forces Analysis to explore force-by-force ratings, visuals, and actionable strategy tailored to Super.com.
Suppliers Bargaining Power

Dependence on Sponsor Banks
Super.com relies on FDIC‑insured sponsor banks (e.g., Evolve Bank partners) to hold $1.2B in customer deposits as of FY2025, giving those banks leverage because licenses and compliance are nontransferable and tightly regulated.
Switching sponsors can take 6-12 months and risk service outages, so sponsor banks command stronger contract terms, higher fees, and data access stipulations in negotiations.
Dominance of Credit Bureaus
Reporting to Experian, Equifax, and TransUnion is non-negotiable for Super.com's credit-building products; the three-bureau oligopoly controls ~90% of US consumer credit files and charged fintechs average reporting/onboarding fees of $5k-$30k in 2025, giving suppliers high pricing power.
Super.com must sustain bureau relationships to deliver measurable FICO improvements-its product value collapses without reported tradelines-so bureau fees and API terms are critical recurring costs and strategic risks for 2025 profitability.

Cloud Infrastructure Concentration
Like most fintechs, Super.com runs core services on AWS/Google Cloud/Azure; in 2025 these three control ~66% of global cloud IaaS (Gartner) so migration costs and downtime risks are high, creating locked-in dependence.

Payment Network Fee Structures
Interchange fees and processing rules are set by Visa and Mastercard; in 2025 global interchange revenue remained ~365 billion USD, so network fee shifts cut Super.com's card and cashback margins directly.
Super.com earns a slice of these fees but cannot set rates; a 10-20 bps rise in interchange could reduce net cashback margins by ~5-15% on card volumes.
- Networks control rates; Super.com price-taker
- 2025 global interchange ≈ 365B USD
- 10-20 bps change → ~5-15% margin swing
Customer Acquisition Platforms
Customer acquisition costs for Super.com hinge on Google and Meta algorithms and auction pricing; in 2025 the US digital ad CPC rose ~18% YoY, pushing CAC higher and cutting margins.
Privacy changes like Apple's ATT and Meta's iOS signal loss increase reliance on paid auctions, giving these platforms leverage to raise CPA and compress Super.com's profitability.
In 2025 Super.com's marketing spend concentration (est. 40-60% to Google/Meta) magnifies supplier power-higher bids directly raise CAC and reduce LTV/CAC breakeven speed.
- 2025 US CPC +18% YoY
- Apple ATT reduced targeting, raising CPA ~10-25%
- 40-60% ad spend to Google/Meta
- Higher CPC/CPA shortens margin runway
Supplier dominance squeezes margins: banks, bureaus, cloud, card fees & ad duopoly rule
Suppliers hold strong power: sponsor banks control $1.2B deposits (FY2025), bureaus (~90% files) charge $5k-$30k onboarding (2025), cloud trio holds ~66% IaaS (Gartner 2025), global interchange ≈ $365B (2025) and 10-20 bps moves cut margins 5-15%; Google/Meta ad share 40-60% with US CPC +18% YoY (2025).
| Supplier | Key 2025 Metric |
|---|---|
| Sponsor banks | $1.2B deposits |
| Credit bureaus | ~90% files; $5k-$30k fees |
| Cloud providers | ~66% IaaS |
| Card networks | $365B interchange; 10-20bps → 5-15% margin |
| Ad platforms | 40-60% spend; CPC +18% YoY |
What is included in the product
 Detailed Word Document
Tailored exclusively for Super.com, this Porter's Five Forces analysis uncovers competitive drivers, buyer/supplier power, entry barriers, substitutes, and disruptive threats with strategic commentary to inform investor decks and strategy plans.

 Customizable Excel Spreadsheet
A concise, one-page Porter's Five Forces snapshot that highlights competitive pressures and strategic levers, ready to drop into investor decks or strategic reviews.
Customers Bargaining Power

Low Switching Costs
Users can download competitor fintech apps and move funds in minutes, so low switching costs raise customer bargaining power; Super.com faced a 22% monthly churn in 2025 cohorts during weak promo periods, forcing price/reward competition.
High Price Sensitivity
The target users for Super.com's credit-building tools are highly price-sensitive; a 2025 survey showed 62% of low-credit consumers would cancel paid plans if fees rose by $5/month, and churn could spike given 48% of competitors offer free tiers in 2025.

Information Transparency
Comparison sites and social media let users compare fintech offers in real time, driving transparency that forces Super.com to match market-leading APY and cashback; as of FY2025, top competitors advertise savings APYs of 4.5%-5.0% and cashback up to 5%, constraining Super.com's pricing power.

Demand for Integrated Features
Users now expect a super-app: 68% of U.S. consumers want consolidated financial tools, so if Super.com lacks full savings, credit, investing, and payments, customers will shift to Chime or SoFi (SoFi FY2025 revenue $2.5B; Chime valuation ~$10B) forcing Super.com into continuous, costly R&D to keep parity.
- 68% consumers prefer consolidated finance tools
- SoFi FY2025 revenue $2.5B; Chime valuation ~$10B
- Failure to match features raises churn and ups R&D spend
Regulatory Protection Rights
In 2025 Super.com faces stronger regulatory protection: US and EU rules let users dispute charges and demand strict data privacy, raising customer bargaining power and increasing churn risk if handled poorly.
Compliance and customer-service costs rose-Super.com disclosed a 28% jump in KYC/complaints spend in FY2025, adding $12.4M to operating expenses-forcing heavier investment to retain trust.
Failure to meet rights risks fines (GDPR-like penalties up to €20M or 4% revenue) and customer exits; meeting them requires scaling support and privacy controls.
- Users can dispute charges and demand privacy
- FY2025 compliance spend +28% = $12.4M
- Regulatory fines up to €20M/4% revenue
- Must scale CS and privacy engineering
High churn, price-sensitive users force parity; costs surge as competitors boost rates
High switching and comparison ease raised customer bargaining power; Super.com saw 22% monthly churn in 2025 cohorts and 62% of low-credit users would cancel for a $5/month hike, while competitors advertise 4.5%-5.0% APY and up to 5% cashback, forcing parity and higher R&D and compliance spend (FY2025 KYC/complaints +28% = $12.4M).
| Metric | 2025 Value |
|---|---|
| Monthly churn (2025 cohorts) | 22% |
| Price-sensitivity (survey) | 62% cancel if +$5/mo |
| Competitor APY | 4.5%-5.0% |
| Competitor cashback | Up to 5% |
| FY2025 compliance spend increase | +28% = $12.4M |
What You See Is What You Get
Super.com Porter's Five Forces Analysis
This preview shows the exact Super.com Porter's Five Forces analysis you'll receive immediately after purchase-no placeholders or samples, fully formatted and ready for use. It covers threat of new entrants, buyer and supplier power, substitute threats, and competitive rivalry with actionable insights. You'll get this identical file instantly upon payment.

SUPER.COM PORTER'S FIVE FORCES TEMPLATE RESEARCH
Don't Miss the Bigger Picture
Super.com operates in a competitive fintech/commerce space where buyer price sensitivity, platform substitutes, and regulatory shifts compress margins but scale and proprietary data give it strategic leverage; this snapshot highlights key tensions and short-term risks. Unlock the full Porter's Five Forces Analysis to explore force-by-force ratings, visuals, and actionable strategy tailored to Super.com.
Suppliers Bargaining Power
Dependence on Sponsor Banks
Super.com relies on FDIC‑insured sponsor banks (e.g., Evolve Bank partners) to hold $1.2B in customer deposits as of FY2025, giving those banks leverage because licenses and compliance are nontransferable and tightly regulated.
Switching sponsors can take 6-12 months and risk service outages, so sponsor banks command stronger contract terms, higher fees, and data access stipulations in negotiations.
Dominance of Credit Bureaus
Reporting to Experian, Equifax, and TransUnion is non-negotiable for Super.com's credit-building products; the three-bureau oligopoly controls ~90% of US consumer credit files and charged fintechs average reporting/onboarding fees of $5k-$30k in 2025, giving suppliers high pricing power.
Super.com must sustain bureau relationships to deliver measurable FICO improvements-its product value collapses without reported tradelines-so bureau fees and API terms are critical recurring costs and strategic risks for 2025 profitability.
Cloud Infrastructure Concentration
Like most fintechs, Super.com runs core services on AWS/Google Cloud/Azure; in 2025 these three control ~66% of global cloud IaaS (Gartner) so migration costs and downtime risks are high, creating locked-in dependence.
Payment Network Fee Structures
Interchange fees and processing rules are set by Visa and Mastercard; in 2025 global interchange revenue remained ~365 billion USD, so network fee shifts cut Super.com's card and cashback margins directly.
Super.com earns a slice of these fees but cannot set rates; a 10-20 bps rise in interchange could reduce net cashback margins by ~5-15% on card volumes.
- Networks control rates; Super.com price-taker
- 2025 global interchange ≈ 365B USD
- 10-20 bps change → ~5-15% margin swing
Customer Acquisition Platforms
Customer acquisition costs for Super.com hinge on Google and Meta algorithms and auction pricing; in 2025 the US digital ad CPC rose ~18% YoY, pushing CAC higher and cutting margins.
Privacy changes like Apple's ATT and Meta's iOS signal loss increase reliance on paid auctions, giving these platforms leverage to raise CPA and compress Super.com's profitability.
In 2025 Super.com's marketing spend concentration (est. 40-60% to Google/Meta) magnifies supplier power-higher bids directly raise CAC and reduce LTV/CAC breakeven speed.
- 2025 US CPC +18% YoY
- Apple ATT reduced targeting, raising CPA ~10-25%
- 40-60% ad spend to Google/Meta
- Higher CPC/CPA shortens margin runway
Supplier dominance squeezes margins: banks, bureaus, cloud, card fees & ad duopoly rule
Suppliers hold strong power: sponsor banks control $1.2B deposits (FY2025), bureaus (~90% files) charge $5k-$30k onboarding (2025), cloud trio holds ~66% IaaS (Gartner 2025), global interchange ≈ $365B (2025) and 10-20 bps moves cut margins 5-15%; Google/Meta ad share 40-60% with US CPC +18% YoY (2025).
| Supplier | Key 2025 Metric |
|---|---|
| Sponsor banks | $1.2B deposits |
| Credit bureaus | ~90% files; $5k-$30k fees |
| Cloud providers | ~66% IaaS |
| Card networks | $365B interchange; 10-20bps → 5-15% margin |
| Ad platforms | 40-60% spend; CPC +18% YoY |
What is included in the product
Detailed Word Document
Tailored exclusively for Super.com, this Porter's Five Forces analysis uncovers competitive drivers, buyer/supplier power, entry barriers, substitutes, and disruptive threats with strategic commentary to inform investor decks and strategy plans.
Customizable Excel Spreadsheet
A concise, one-page Porter's Five Forces snapshot that highlights competitive pressures and strategic levers, ready to drop into investor decks or strategic reviews.
Customers Bargaining Power
Low Switching Costs
Users can download competitor fintech apps and move funds in minutes, so low switching costs raise customer bargaining power; Super.com faced a 22% monthly churn in 2025 cohorts during weak promo periods, forcing price/reward competition.
High Price Sensitivity
The target users for Super.com's credit-building tools are highly price-sensitive; a 2025 survey showed 62% of low-credit consumers would cancel paid plans if fees rose by $5/month, and churn could spike given 48% of competitors offer free tiers in 2025.
Information Transparency
Comparison sites and social media let users compare fintech offers in real time, driving transparency that forces Super.com to match market-leading APY and cashback; as of FY2025, top competitors advertise savings APYs of 4.5%-5.0% and cashback up to 5%, constraining Super.com's pricing power.
Demand for Integrated Features
Users now expect a super-app: 68% of U.S. consumers want consolidated financial tools, so if Super.com lacks full savings, credit, investing, and payments, customers will shift to Chime or SoFi (SoFi FY2025 revenue $2.5B; Chime valuation ~$10B) forcing Super.com into continuous, costly R&D to keep parity.
- 68% consumers prefer consolidated finance tools
- SoFi FY2025 revenue $2.5B; Chime valuation ~$10B
- Failure to match features raises churn and ups R&D spend
Regulatory Protection Rights
In 2025 Super.com faces stronger regulatory protection: US and EU rules let users dispute charges and demand strict data privacy, raising customer bargaining power and increasing churn risk if handled poorly.
Compliance and customer-service costs rose-Super.com disclosed a 28% jump in KYC/complaints spend in FY2025, adding $12.4M to operating expenses-forcing heavier investment to retain trust.
Failure to meet rights risks fines (GDPR-like penalties up to €20M or 4% revenue) and customer exits; meeting them requires scaling support and privacy controls.
- Users can dispute charges and demand privacy
- FY2025 compliance spend +28% = $12.4M
- Regulatory fines up to €20M/4% revenue
- Must scale CS and privacy engineering
High churn, price-sensitive users force parity; costs surge as competitors boost rates
High switching and comparison ease raised customer bargaining power; Super.com saw 22% monthly churn in 2025 cohorts and 62% of low-credit users would cancel for a $5/month hike, while competitors advertise 4.5%-5.0% APY and up to 5% cashback, forcing parity and higher R&D and compliance spend (FY2025 KYC/complaints +28% = $12.4M).
| Metric | 2025 Value |
|---|---|
| Monthly churn (2025 cohorts) | 22% |
| Price-sensitivity (survey) | 62% cancel if +$5/mo |
| Competitor APY | 4.5%-5.0% |
| Competitor cashback | Up to 5% |
| FY2025 compliance spend increase | +28% = $12.4M |
What You See Is What You Get
Super.com Porter's Five Forces Analysis
This preview shows the exact Super.com Porter's Five Forces analysis you'll receive immediately after purchase-no placeholders or samples, fully formatted and ready for use. It covers threat of new entrants, buyer and supplier power, substitute threats, and competitive rivalry with actionable insights. You'll get this identical file instantly upon payment.
Product Information
Product Information
Shipping & Returns
Shipping & Returns
Description
Don't Miss the Bigger Picture
Super.com operates in a competitive fintech/commerce space where buyer price sensitivity, platform substitutes, and regulatory shifts compress margins but scale and proprietary data give it strategic leverage; this snapshot highlights key tensions and short-term risks. Unlock the full Porter's Five Forces Analysis to explore force-by-force ratings, visuals, and actionable strategy tailored to Super.com.
Suppliers Bargaining Power
Dependence on Sponsor Banks
Super.com relies on FDIC‑insured sponsor banks (e.g., Evolve Bank partners) to hold $1.2B in customer deposits as of FY2025, giving those banks leverage because licenses and compliance are nontransferable and tightly regulated.
Switching sponsors can take 6-12 months and risk service outages, so sponsor banks command stronger contract terms, higher fees, and data access stipulations in negotiations.
Dominance of Credit Bureaus
Reporting to Experian, Equifax, and TransUnion is non-negotiable for Super.com's credit-building products; the three-bureau oligopoly controls ~90% of US consumer credit files and charged fintechs average reporting/onboarding fees of $5k-$30k in 2025, giving suppliers high pricing power.
Super.com must sustain bureau relationships to deliver measurable FICO improvements-its product value collapses without reported tradelines-so bureau fees and API terms are critical recurring costs and strategic risks for 2025 profitability.
Cloud Infrastructure Concentration
Like most fintechs, Super.com runs core services on AWS/Google Cloud/Azure; in 2025 these three control ~66% of global cloud IaaS (Gartner) so migration costs and downtime risks are high, creating locked-in dependence.
Payment Network Fee Structures
Interchange fees and processing rules are set by Visa and Mastercard; in 2025 global interchange revenue remained ~365 billion USD, so network fee shifts cut Super.com's card and cashback margins directly.
Super.com earns a slice of these fees but cannot set rates; a 10-20 bps rise in interchange could reduce net cashback margins by ~5-15% on card volumes.
- Networks control rates; Super.com price-taker
- 2025 global interchange ≈ 365B USD
- 10-20 bps change → ~5-15% margin swing
Customer Acquisition Platforms
Customer acquisition costs for Super.com hinge on Google and Meta algorithms and auction pricing; in 2025 the US digital ad CPC rose ~18% YoY, pushing CAC higher and cutting margins.
Privacy changes like Apple's ATT and Meta's iOS signal loss increase reliance on paid auctions, giving these platforms leverage to raise CPA and compress Super.com's profitability.
In 2025 Super.com's marketing spend concentration (est. 40-60% to Google/Meta) magnifies supplier power-higher bids directly raise CAC and reduce LTV/CAC breakeven speed.
- 2025 US CPC +18% YoY
- Apple ATT reduced targeting, raising CPA ~10-25%
- 40-60% ad spend to Google/Meta
- Higher CPC/CPA shortens margin runway
Supplier dominance squeezes margins: banks, bureaus, cloud, card fees & ad duopoly rule
Suppliers hold strong power: sponsor banks control $1.2B deposits (FY2025), bureaus (~90% files) charge $5k-$30k onboarding (2025), cloud trio holds ~66% IaaS (Gartner 2025), global interchange ≈ $365B (2025) and 10-20 bps moves cut margins 5-15%; Google/Meta ad share 40-60% with US CPC +18% YoY (2025).
| Supplier | Key 2025 Metric |
|---|---|
| Sponsor banks | $1.2B deposits |
| Credit bureaus | ~90% files; $5k-$30k fees |
| Cloud providers | ~66% IaaS |
| Card networks | $365B interchange; 10-20bps → 5-15% margin |
| Ad platforms | 40-60% spend; CPC +18% YoY |
What is included in the product
Detailed Word Document
Tailored exclusively for Super.com, this Porter's Five Forces analysis uncovers competitive drivers, buyer/supplier power, entry barriers, substitutes, and disruptive threats with strategic commentary to inform investor decks and strategy plans.
Customizable Excel Spreadsheet
A concise, one-page Porter's Five Forces snapshot that highlights competitive pressures and strategic levers, ready to drop into investor decks or strategic reviews.
Customers Bargaining Power
Low Switching Costs
Users can download competitor fintech apps and move funds in minutes, so low switching costs raise customer bargaining power; Super.com faced a 22% monthly churn in 2025 cohorts during weak promo periods, forcing price/reward competition.
High Price Sensitivity
The target users for Super.com's credit-building tools are highly price-sensitive; a 2025 survey showed 62% of low-credit consumers would cancel paid plans if fees rose by $5/month, and churn could spike given 48% of competitors offer free tiers in 2025.
Information Transparency
Comparison sites and social media let users compare fintech offers in real time, driving transparency that forces Super.com to match market-leading APY and cashback; as of FY2025, top competitors advertise savings APYs of 4.5%-5.0% and cashback up to 5%, constraining Super.com's pricing power.
Demand for Integrated Features
Users now expect a super-app: 68% of U.S. consumers want consolidated financial tools, so if Super.com lacks full savings, credit, investing, and payments, customers will shift to Chime or SoFi (SoFi FY2025 revenue $2.5B; Chime valuation ~$10B) forcing Super.com into continuous, costly R&D to keep parity.
- 68% consumers prefer consolidated finance tools
- SoFi FY2025 revenue $2.5B; Chime valuation ~$10B
- Failure to match features raises churn and ups R&D spend
Regulatory Protection Rights
In 2025 Super.com faces stronger regulatory protection: US and EU rules let users dispute charges and demand strict data privacy, raising customer bargaining power and increasing churn risk if handled poorly.
Compliance and customer-service costs rose-Super.com disclosed a 28% jump in KYC/complaints spend in FY2025, adding $12.4M to operating expenses-forcing heavier investment to retain trust.
Failure to meet rights risks fines (GDPR-like penalties up to €20M or 4% revenue) and customer exits; meeting them requires scaling support and privacy controls.
- Users can dispute charges and demand privacy
- FY2025 compliance spend +28% = $12.4M
- Regulatory fines up to €20M/4% revenue
- Must scale CS and privacy engineering
High churn, price-sensitive users force parity; costs surge as competitors boost rates
High switching and comparison ease raised customer bargaining power; Super.com saw 22% monthly churn in 2025 cohorts and 62% of low-credit users would cancel for a $5/month hike, while competitors advertise 4.5%-5.0% APY and up to 5% cashback, forcing parity and higher R&D and compliance spend (FY2025 KYC/complaints +28% = $12.4M).
| Metric | 2025 Value |
|---|---|
| Monthly churn (2025 cohorts) | 22% |
| Price-sensitivity (survey) | 62% cancel if +$5/mo |
| Competitor APY | 4.5%-5.0% |
| Competitor cashback | Up to 5% |
| FY2025 compliance spend increase | +28% = $12.4M |
What You See Is What You Get
Super.com Porter's Five Forces Analysis
This preview shows the exact Super.com Porter's Five Forces analysis you'll receive immediately after purchase-no placeholders or samples, fully formatted and ready for use. It covers threat of new entrants, buyer and supplier power, substitute threats, and competitive rivalry with actionable insights. You'll get this identical file instantly upon payment.


