
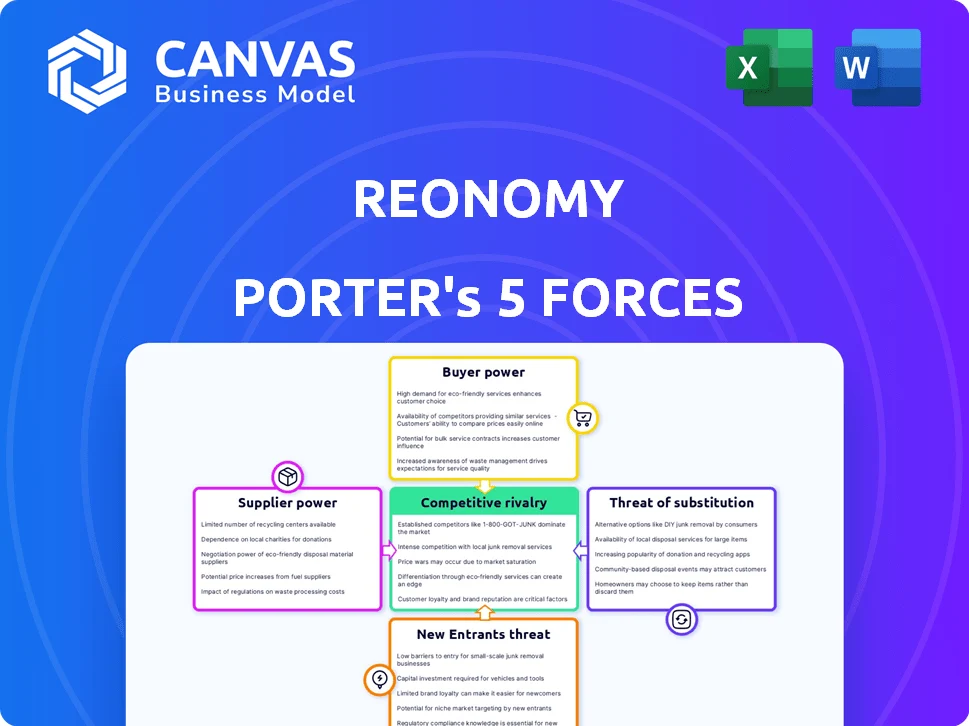
REONOMY PORTER'S FIVE FORCES TEMPLATE RESEARCH
What is included in the product
 Detailed Word Document
Tailored exclusively for Reonomy, analyzing its position within its competitive landscape.

 Customizable Excel Spreadsheet
Instantly understand strategic pressure with a powerful spider/radar chart.
Preview Before You Purchase
Reonomy Porter's Five Forces Analysis
This preview presents the identical Porter's Five Forces analysis of Reonomy you'll receive. It details the competitive landscape, threats, and opportunities facing Reonomy.
This includes industry rivalry, bargaining power of suppliers and buyers, and potential new entrants and substitutes.
The complete document provides a clear, concise evaluation, ready for your immediate review and application.
The format ensures ease of understanding and use, allowing for quick comprehension of Reonomy's market position.
The document is fully prepared. You can download it instantly post-purchase.

Porter's Five Forces Analysis Template

Elevate Your Analysis with the Complete Porter's Five Forces Analysis
Reonomy navigates a complex real estate data landscape. Supplier power, particularly data providers, impacts its cost structure. Buyer power from investors and developers shapes pricing. The threat of new entrants, especially from tech firms, is a constant concern. Substitute threats from alternative data sources exist. Competitive rivalry is fierce.
This brief snapshot only scratches the surface. Unlock the full Porter's Five Forces Analysis to explore Reonomy’s competitive dynamics, market pressures, and strategic advantages in detail.
Suppliers Bargaining Power

Data Providers
Reonomy's reliance on data suppliers, like public record providers and third-party partners, is crucial. The bargaining power of these suppliers varies; those with unique, essential data hold more leverage. For example, the cost of commercial real estate data from major providers increased by 5-7% in 2024. This increase highlights the impact of supplier power.
Technology Providers
Reonomy's reliance on tech suppliers for AI and data processing gives these suppliers significant power. The more complex and specialized the tech, the stronger the supplier's leverage. In 2024, the AI market saw NVIDIA's revenue up 126% due to high demand. This reflects the supplier's strong position.

Talent Pool
Reonomy's success hinges on its ability to attract and retain top talent, including data scientists and real estate experts. The bargaining power of this talent pool is significant due to high demand. In 2024, the average salary for data scientists in the U.S. was around $120,000 - $160,000.

Exclusivity of Data Partnerships
Reonomy's exclusive data partnerships significantly influence supplier bargaining power. The more unique and valuable the data, the stronger the suppliers' position. For instance, if a data provider offers the only source for specific property data, their leverage increases. This exclusivity can lead to higher prices and more favorable terms for suppliers.
- Exclusive data access gives suppliers pricing power.
- Reonomy's reliance on specific data sources impacts its costs.
- Suppliers with critical data can dictate contract terms.
- The value of data directly affects supplier bargaining strength.
Cost of Data Acquisition
The cost of acquiring data significantly influences supplier power, especially in real estate. High data acquisition costs, including expenses for purchase, cleaning, and integration, can increase supplier leverage. Real estate data, for instance, saw prices rise, with some datasets costing thousands of dollars annually by late 2024. This cost dynamic impacts the ability to switch suppliers.
- Data Acquisition Costs: Vary widely depending on data type and provider.
- Data Integration: Can be complex, requiring specialized skills and tools.
- Supplier Concentration: Limited suppliers can increase pricing power.
- Data Quality: Impacts the usefulness and value of the acquired data.
Supplier Dynamics: Impacting Costs and Strategy
The bargaining power of suppliers significantly impacts Reonomy's operational costs and strategic flexibility. Exclusive data providers and tech suppliers hold substantial leverage, influencing pricing and contract terms. In 2024, data acquisition costs rose, reflecting supplier strength.
| Supplier Type | Impact on Reonomy | 2024 Data Point |
|---|---|---|
| Data Providers | Pricing Power | Commercial real estate data cost increase: 5-7% |
| Tech Suppliers | Influence on Costs | NVIDIA revenue up 126% due to high demand |
| Talent | Salary Demands | Data scientist avg. salary: $120K-$160K |
Customers Bargaining Power

Customer Concentration
Reonomy's customer base includes investors, brokers, and lenders. Customer concentration impacts bargaining power; large clients wield more influence. For instance, a major institutional investor managing a $500 million portfolio might negotiate better terms than a small brokerage. In 2024, the commercial real estate market saw a shift, with institutional investors accounting for a larger share of transactions.
Switching Costs
Switching costs are crucial in customer bargaining power. High integration costs for platforms like Reonomy, mean higher switching costs, reducing customer power. If switching to another platform is complex, customers are less likely to leave. In 2024, the average cost to integrate a new CRM system was $15,000, showing the impact of switching costs.

Availability of Alternatives
Customers gain leverage when many alternative data providers exist. In 2024, the CRE tech market saw over 4,000 proptech companies. This abundance allows customers to compare pricing and services easily. Increased competition among providers, like CoStar and Reonomy, further enhances customer bargaining power. This dynamic pushes providers to offer competitive rates and better terms.

Price Sensitivity
Customers' price sensitivity significantly influences their bargaining power within Reonomy's market. In a competitive landscape, customers can compare pricing models, increasing their ability to negotiate. For instance, if Reonomy's pricing is perceived as high compared to competitors, customers might seek discounts or alternative solutions. This dynamic underscores the importance of competitive pricing strategies.
- Competitive pricing pressures can intensify customer bargaining power, potentially impacting Reonomy's revenue.
- Customers' willingness to switch to cheaper alternatives directly affects Reonomy's pricing flexibility.
- Market analysis suggests that approximately 20% of real estate tech customers actively seek price negotiations.
- Reonomy's ability to retain customers hinges on offering competitive value propositions.
Customer's Access to Data
Customers' access to data alternatives heavily influences their bargaining power. If clients can find similar property data elsewhere, like public records or other platforms, their reliance on Reonomy decreases. This access allows them to negotiate better pricing or terms. For example, in 2024, the use of open-source property data increased by 15% due to improved accessibility.
- Alternative data sources availability directly impacts customer leverage.
- Increased data accessibility reduces customer dependency on a single provider.
- Customers with more options can negotiate more favorable deals.
- The rise of open-source data is a growing trend.
Customer Power Dynamics in Proptech
Customer bargaining power in Reonomy's market is shaped by factors like market competition and data accessibility. In 2024, the presence of over 4,000 proptech firms increased customer options. This competition, alongside the rise of open-source data, empowers customers to negotiate better terms.
| Factor | Impact | 2024 Data |
|---|---|---|
| Competition | Increases Customer Leverage | 4,000+ Proptech Companies |
| Data Access | Reduces Dependency | 15% rise in open-source data use |
| Price Sensitivity | Enhances Negotiation | 20% actively seek price cuts |
Rivalry Among Competitors

Number and Diversity of Competitors
The commercial real estate data and analytics market sees intense competition. There are numerous competitors, including giants like CoStar and smaller specialized firms. This diversity and high number of rivals heighten competitive pressures. For example, CoStar's revenue in 2023 was $2.5 billion. This indicates a very competitive environment.
Market Growth Rate
The commercial real estate software market is expanding, which influences competitive rivalry. Market growth often eases rivalry because numerous firms can thrive. In 2024, the sector's value reached $1.2 billion. However, Reonomy's segment dynamics could differ.

Product Differentiation
Product differentiation at Reonomy influences competitive rivalry. A platform with unique features and data accuracy lessens competition. In 2024, companies with superior AI saw a 15% market share increase. Differentiated offerings boost customer loyalty and reduce price wars.

Switching Costs for Customers
Switching costs significantly influence competitive dynamics. When customers face low switching costs, rivalry intensifies, as they can readily switch to competitors offering better value. This ease of movement forces businesses to compete more aggressively on price, service, and innovation to retain customers. For instance, in 2024, the average customer churn rate in the telecom industry was around 20%, highlighting the impact of low switching costs due to readily available alternatives and easy portability.
- Low switching costs mean customers can easily choose alternatives.
- Increased competition on price and service is a common outcome.
- Businesses must focus on customer retention strategies.
- Telecom churn rate in 2024 shows the impact of easy switching.
Exit Barriers
High exit barriers, such as specialized assets or long-term contracts, can trap firms in an industry. This can intensify rivalry as companies compete fiercely to survive. For example, the airline industry, with its high capital investments, shows this dynamic. In 2024, the airline industry's net profit margin was about 3.7%. This underscores the pressure to maintain market share.
- High exit barriers increase competition.
- Unprofitable companies may persist.
- Firms fight for market share.
- Capital-intensive industries are affected.
Commercial Real Estate: Key Competitive Factors
Competitive rivalry in the commercial real estate market is shaped by many players. Market growth, like the 2024 sector value of $1.2 billion, can influence intensity. Product differentiation and switching costs also play a crucial role in shaping competition.
| Factor | Impact | Example |
|---|---|---|
| Competitor Number | High number increases competition | CoStar's 2023 revenue: $2.5B |
| Market Growth | Can ease rivalry if high | 2024 Sector Value: $1.2B |
| Differentiation | Reduces rivalry if unique | AI market share increase: 15% |
REONOMY PORTER'S FIVE FORCES TEMPLATE RESEARCH
What is included in the product
Detailed Word Document
Tailored exclusively for Reonomy, analyzing its position within its competitive landscape.
Customizable Excel Spreadsheet
Instantly understand strategic pressure with a powerful spider/radar chart.
Preview Before You Purchase
Reonomy Porter's Five Forces Analysis
This preview presents the identical Porter's Five Forces analysis of Reonomy you'll receive. It details the competitive landscape, threats, and opportunities facing Reonomy.
This includes industry rivalry, bargaining power of suppliers and buyers, and potential new entrants and substitutes.
The complete document provides a clear, concise evaluation, ready for your immediate review and application.
The format ensures ease of understanding and use, allowing for quick comprehension of Reonomy's market position.
The document is fully prepared. You can download it instantly post-purchase.
Porter's Five Forces Analysis Template
Elevate Your Analysis with the Complete Porter's Five Forces Analysis
Reonomy navigates a complex real estate data landscape. Supplier power, particularly data providers, impacts its cost structure. Buyer power from investors and developers shapes pricing. The threat of new entrants, especially from tech firms, is a constant concern. Substitute threats from alternative data sources exist. Competitive rivalry is fierce.
This brief snapshot only scratches the surface. Unlock the full Porter's Five Forces Analysis to explore Reonomy’s competitive dynamics, market pressures, and strategic advantages in detail.
Suppliers Bargaining Power
Data Providers
Reonomy's reliance on data suppliers, like public record providers and third-party partners, is crucial. The bargaining power of these suppliers varies; those with unique, essential data hold more leverage. For example, the cost of commercial real estate data from major providers increased by 5-7% in 2024. This increase highlights the impact of supplier power.
Technology Providers
Reonomy's reliance on tech suppliers for AI and data processing gives these suppliers significant power. The more complex and specialized the tech, the stronger the supplier's leverage. In 2024, the AI market saw NVIDIA's revenue up 126% due to high demand. This reflects the supplier's strong position.
Talent Pool
Reonomy's success hinges on its ability to attract and retain top talent, including data scientists and real estate experts. The bargaining power of this talent pool is significant due to high demand. In 2024, the average salary for data scientists in the U.S. was around $120,000 - $160,000.
Exclusivity of Data Partnerships
Reonomy's exclusive data partnerships significantly influence supplier bargaining power. The more unique and valuable the data, the stronger the suppliers' position. For instance, if a data provider offers the only source for specific property data, their leverage increases. This exclusivity can lead to higher prices and more favorable terms for suppliers.
- Exclusive data access gives suppliers pricing power.
- Reonomy's reliance on specific data sources impacts its costs.
- Suppliers with critical data can dictate contract terms.
- The value of data directly affects supplier bargaining strength.
Cost of Data Acquisition
The cost of acquiring data significantly influences supplier power, especially in real estate. High data acquisition costs, including expenses for purchase, cleaning, and integration, can increase supplier leverage. Real estate data, for instance, saw prices rise, with some datasets costing thousands of dollars annually by late 2024. This cost dynamic impacts the ability to switch suppliers.
- Data Acquisition Costs: Vary widely depending on data type and provider.
- Data Integration: Can be complex, requiring specialized skills and tools.
- Supplier Concentration: Limited suppliers can increase pricing power.
- Data Quality: Impacts the usefulness and value of the acquired data.
Supplier Dynamics: Impacting Costs and Strategy
The bargaining power of suppliers significantly impacts Reonomy's operational costs and strategic flexibility. Exclusive data providers and tech suppliers hold substantial leverage, influencing pricing and contract terms. In 2024, data acquisition costs rose, reflecting supplier strength.
| Supplier Type | Impact on Reonomy | 2024 Data Point |
|---|---|---|
| Data Providers | Pricing Power | Commercial real estate data cost increase: 5-7% |
| Tech Suppliers | Influence on Costs | NVIDIA revenue up 126% due to high demand |
| Talent | Salary Demands | Data scientist avg. salary: $120K-$160K |
Customers Bargaining Power
Customer Concentration
Reonomy's customer base includes investors, brokers, and lenders. Customer concentration impacts bargaining power; large clients wield more influence. For instance, a major institutional investor managing a $500 million portfolio might negotiate better terms than a small brokerage. In 2024, the commercial real estate market saw a shift, with institutional investors accounting for a larger share of transactions.
Switching Costs
Switching costs are crucial in customer bargaining power. High integration costs for platforms like Reonomy, mean higher switching costs, reducing customer power. If switching to another platform is complex, customers are less likely to leave. In 2024, the average cost to integrate a new CRM system was $15,000, showing the impact of switching costs.
Availability of Alternatives
Customers gain leverage when many alternative data providers exist. In 2024, the CRE tech market saw over 4,000 proptech companies. This abundance allows customers to compare pricing and services easily. Increased competition among providers, like CoStar and Reonomy, further enhances customer bargaining power. This dynamic pushes providers to offer competitive rates and better terms.
Price Sensitivity
Customers' price sensitivity significantly influences their bargaining power within Reonomy's market. In a competitive landscape, customers can compare pricing models, increasing their ability to negotiate. For instance, if Reonomy's pricing is perceived as high compared to competitors, customers might seek discounts or alternative solutions. This dynamic underscores the importance of competitive pricing strategies.
- Competitive pricing pressures can intensify customer bargaining power, potentially impacting Reonomy's revenue.
- Customers' willingness to switch to cheaper alternatives directly affects Reonomy's pricing flexibility.
- Market analysis suggests that approximately 20% of real estate tech customers actively seek price negotiations.
- Reonomy's ability to retain customers hinges on offering competitive value propositions.
Customer's Access to Data
Customers' access to data alternatives heavily influences their bargaining power. If clients can find similar property data elsewhere, like public records or other platforms, their reliance on Reonomy decreases. This access allows them to negotiate better pricing or terms. For example, in 2024, the use of open-source property data increased by 15% due to improved accessibility.
- Alternative data sources availability directly impacts customer leverage.
- Increased data accessibility reduces customer dependency on a single provider.
- Customers with more options can negotiate more favorable deals.
- The rise of open-source data is a growing trend.
Customer Power Dynamics in Proptech
Customer bargaining power in Reonomy's market is shaped by factors like market competition and data accessibility. In 2024, the presence of over 4,000 proptech firms increased customer options. This competition, alongside the rise of open-source data, empowers customers to negotiate better terms.
| Factor | Impact | 2024 Data |
|---|---|---|
| Competition | Increases Customer Leverage | 4,000+ Proptech Companies |
| Data Access | Reduces Dependency | 15% rise in open-source data use |
| Price Sensitivity | Enhances Negotiation | 20% actively seek price cuts |
Rivalry Among Competitors
Number and Diversity of Competitors
The commercial real estate data and analytics market sees intense competition. There are numerous competitors, including giants like CoStar and smaller specialized firms. This diversity and high number of rivals heighten competitive pressures. For example, CoStar's revenue in 2023 was $2.5 billion. This indicates a very competitive environment.
Market Growth Rate
The commercial real estate software market is expanding, which influences competitive rivalry. Market growth often eases rivalry because numerous firms can thrive. In 2024, the sector's value reached $1.2 billion. However, Reonomy's segment dynamics could differ.
Product Differentiation
Product differentiation at Reonomy influences competitive rivalry. A platform with unique features and data accuracy lessens competition. In 2024, companies with superior AI saw a 15% market share increase. Differentiated offerings boost customer loyalty and reduce price wars.
Switching Costs for Customers
Switching costs significantly influence competitive dynamics. When customers face low switching costs, rivalry intensifies, as they can readily switch to competitors offering better value. This ease of movement forces businesses to compete more aggressively on price, service, and innovation to retain customers. For instance, in 2024, the average customer churn rate in the telecom industry was around 20%, highlighting the impact of low switching costs due to readily available alternatives and easy portability.
- Low switching costs mean customers can easily choose alternatives.
- Increased competition on price and service is a common outcome.
- Businesses must focus on customer retention strategies.
- Telecom churn rate in 2024 shows the impact of easy switching.
Exit Barriers
High exit barriers, such as specialized assets or long-term contracts, can trap firms in an industry. This can intensify rivalry as companies compete fiercely to survive. For example, the airline industry, with its high capital investments, shows this dynamic. In 2024, the airline industry's net profit margin was about 3.7%. This underscores the pressure to maintain market share.
- High exit barriers increase competition.
- Unprofitable companies may persist.
- Firms fight for market share.
- Capital-intensive industries are affected.
Commercial Real Estate: Key Competitive Factors
Competitive rivalry in the commercial real estate market is shaped by many players. Market growth, like the 2024 sector value of $1.2 billion, can influence intensity. Product differentiation and switching costs also play a crucial role in shaping competition.
| Factor | Impact | Example |
|---|---|---|
| Competitor Number | High number increases competition | CoStar's 2023 revenue: $2.5B |
| Market Growth | Can ease rivalry if high | 2024 Sector Value: $1.2B |
| Differentiation | Reduces rivalry if unique | AI market share increase: 15% |
Product Information
Product Information
Shipping & Returns
Shipping & Returns
Description
What is included in the product
Detailed Word Document
Tailored exclusively for Reonomy, analyzing its position within its competitive landscape.
Customizable Excel Spreadsheet
Instantly understand strategic pressure with a powerful spider/radar chart.
Preview Before You Purchase
Reonomy Porter's Five Forces Analysis
This preview presents the identical Porter's Five Forces analysis of Reonomy you'll receive. It details the competitive landscape, threats, and opportunities facing Reonomy.
This includes industry rivalry, bargaining power of suppliers and buyers, and potential new entrants and substitutes.
The complete document provides a clear, concise evaluation, ready for your immediate review and application.
The format ensures ease of understanding and use, allowing for quick comprehension of Reonomy's market position.
The document is fully prepared. You can download it instantly post-purchase.
Porter's Five Forces Analysis Template
Elevate Your Analysis with the Complete Porter's Five Forces Analysis
Reonomy navigates a complex real estate data landscape. Supplier power, particularly data providers, impacts its cost structure. Buyer power from investors and developers shapes pricing. The threat of new entrants, especially from tech firms, is a constant concern. Substitute threats from alternative data sources exist. Competitive rivalry is fierce.
This brief snapshot only scratches the surface. Unlock the full Porter's Five Forces Analysis to explore Reonomy’s competitive dynamics, market pressures, and strategic advantages in detail.
Suppliers Bargaining Power
Data Providers
Reonomy's reliance on data suppliers, like public record providers and third-party partners, is crucial. The bargaining power of these suppliers varies; those with unique, essential data hold more leverage. For example, the cost of commercial real estate data from major providers increased by 5-7% in 2024. This increase highlights the impact of supplier power.
Technology Providers
Reonomy's reliance on tech suppliers for AI and data processing gives these suppliers significant power. The more complex and specialized the tech, the stronger the supplier's leverage. In 2024, the AI market saw NVIDIA's revenue up 126% due to high demand. This reflects the supplier's strong position.
Talent Pool
Reonomy's success hinges on its ability to attract and retain top talent, including data scientists and real estate experts. The bargaining power of this talent pool is significant due to high demand. In 2024, the average salary for data scientists in the U.S. was around $120,000 - $160,000.
Exclusivity of Data Partnerships
Reonomy's exclusive data partnerships significantly influence supplier bargaining power. The more unique and valuable the data, the stronger the suppliers' position. For instance, if a data provider offers the only source for specific property data, their leverage increases. This exclusivity can lead to higher prices and more favorable terms for suppliers.
- Exclusive data access gives suppliers pricing power.
- Reonomy's reliance on specific data sources impacts its costs.
- Suppliers with critical data can dictate contract terms.
- The value of data directly affects supplier bargaining strength.
Cost of Data Acquisition
The cost of acquiring data significantly influences supplier power, especially in real estate. High data acquisition costs, including expenses for purchase, cleaning, and integration, can increase supplier leverage. Real estate data, for instance, saw prices rise, with some datasets costing thousands of dollars annually by late 2024. This cost dynamic impacts the ability to switch suppliers.
- Data Acquisition Costs: Vary widely depending on data type and provider.
- Data Integration: Can be complex, requiring specialized skills and tools.
- Supplier Concentration: Limited suppliers can increase pricing power.
- Data Quality: Impacts the usefulness and value of the acquired data.
Supplier Dynamics: Impacting Costs and Strategy
The bargaining power of suppliers significantly impacts Reonomy's operational costs and strategic flexibility. Exclusive data providers and tech suppliers hold substantial leverage, influencing pricing and contract terms. In 2024, data acquisition costs rose, reflecting supplier strength.
| Supplier Type | Impact on Reonomy | 2024 Data Point |
|---|---|---|
| Data Providers | Pricing Power | Commercial real estate data cost increase: 5-7% |
| Tech Suppliers | Influence on Costs | NVIDIA revenue up 126% due to high demand |
| Talent | Salary Demands | Data scientist avg. salary: $120K-$160K |
Customers Bargaining Power
Customer Concentration
Reonomy's customer base includes investors, brokers, and lenders. Customer concentration impacts bargaining power; large clients wield more influence. For instance, a major institutional investor managing a $500 million portfolio might negotiate better terms than a small brokerage. In 2024, the commercial real estate market saw a shift, with institutional investors accounting for a larger share of transactions.
Switching Costs
Switching costs are crucial in customer bargaining power. High integration costs for platforms like Reonomy, mean higher switching costs, reducing customer power. If switching to another platform is complex, customers are less likely to leave. In 2024, the average cost to integrate a new CRM system was $15,000, showing the impact of switching costs.
Availability of Alternatives
Customers gain leverage when many alternative data providers exist. In 2024, the CRE tech market saw over 4,000 proptech companies. This abundance allows customers to compare pricing and services easily. Increased competition among providers, like CoStar and Reonomy, further enhances customer bargaining power. This dynamic pushes providers to offer competitive rates and better terms.
Price Sensitivity
Customers' price sensitivity significantly influences their bargaining power within Reonomy's market. In a competitive landscape, customers can compare pricing models, increasing their ability to negotiate. For instance, if Reonomy's pricing is perceived as high compared to competitors, customers might seek discounts or alternative solutions. This dynamic underscores the importance of competitive pricing strategies.
- Competitive pricing pressures can intensify customer bargaining power, potentially impacting Reonomy's revenue.
- Customers' willingness to switch to cheaper alternatives directly affects Reonomy's pricing flexibility.
- Market analysis suggests that approximately 20% of real estate tech customers actively seek price negotiations.
- Reonomy's ability to retain customers hinges on offering competitive value propositions.
Customer's Access to Data
Customers' access to data alternatives heavily influences their bargaining power. If clients can find similar property data elsewhere, like public records or other platforms, their reliance on Reonomy decreases. This access allows them to negotiate better pricing or terms. For example, in 2024, the use of open-source property data increased by 15% due to improved accessibility.
- Alternative data sources availability directly impacts customer leverage.
- Increased data accessibility reduces customer dependency on a single provider.
- Customers with more options can negotiate more favorable deals.
- The rise of open-source data is a growing trend.
Customer Power Dynamics in Proptech
Customer bargaining power in Reonomy's market is shaped by factors like market competition and data accessibility. In 2024, the presence of over 4,000 proptech firms increased customer options. This competition, alongside the rise of open-source data, empowers customers to negotiate better terms.
| Factor | Impact | 2024 Data |
|---|---|---|
| Competition | Increases Customer Leverage | 4,000+ Proptech Companies |
| Data Access | Reduces Dependency | 15% rise in open-source data use |
| Price Sensitivity | Enhances Negotiation | 20% actively seek price cuts |
Rivalry Among Competitors
Number and Diversity of Competitors
The commercial real estate data and analytics market sees intense competition. There are numerous competitors, including giants like CoStar and smaller specialized firms. This diversity and high number of rivals heighten competitive pressures. For example, CoStar's revenue in 2023 was $2.5 billion. This indicates a very competitive environment.
Market Growth Rate
The commercial real estate software market is expanding, which influences competitive rivalry. Market growth often eases rivalry because numerous firms can thrive. In 2024, the sector's value reached $1.2 billion. However, Reonomy's segment dynamics could differ.
Product Differentiation
Product differentiation at Reonomy influences competitive rivalry. A platform with unique features and data accuracy lessens competition. In 2024, companies with superior AI saw a 15% market share increase. Differentiated offerings boost customer loyalty and reduce price wars.
Switching Costs for Customers
Switching costs significantly influence competitive dynamics. When customers face low switching costs, rivalry intensifies, as they can readily switch to competitors offering better value. This ease of movement forces businesses to compete more aggressively on price, service, and innovation to retain customers. For instance, in 2024, the average customer churn rate in the telecom industry was around 20%, highlighting the impact of low switching costs due to readily available alternatives and easy portability.
- Low switching costs mean customers can easily choose alternatives.
- Increased competition on price and service is a common outcome.
- Businesses must focus on customer retention strategies.
- Telecom churn rate in 2024 shows the impact of easy switching.
Exit Barriers
High exit barriers, such as specialized assets or long-term contracts, can trap firms in an industry. This can intensify rivalry as companies compete fiercely to survive. For example, the airline industry, with its high capital investments, shows this dynamic. In 2024, the airline industry's net profit margin was about 3.7%. This underscores the pressure to maintain market share.
- High exit barriers increase competition.
- Unprofitable companies may persist.
- Firms fight for market share.
- Capital-intensive industries are affected.
Commercial Real Estate: Key Competitive Factors
Competitive rivalry in the commercial real estate market is shaped by many players. Market growth, like the 2024 sector value of $1.2 billion, can influence intensity. Product differentiation and switching costs also play a crucial role in shaping competition.
| Factor | Impact | Example |
|---|---|---|
| Competitor Number | High number increases competition | CoStar's 2023 revenue: $2.5B |
| Market Growth | Can ease rivalry if high | 2024 Sector Value: $1.2B |
| Differentiation | Reduces rivalry if unique | AI market share increase: 15% |


