
RAKUTEN BCG MATRIX TEMPLATE RESEARCH

Unlock Strategic Clarity
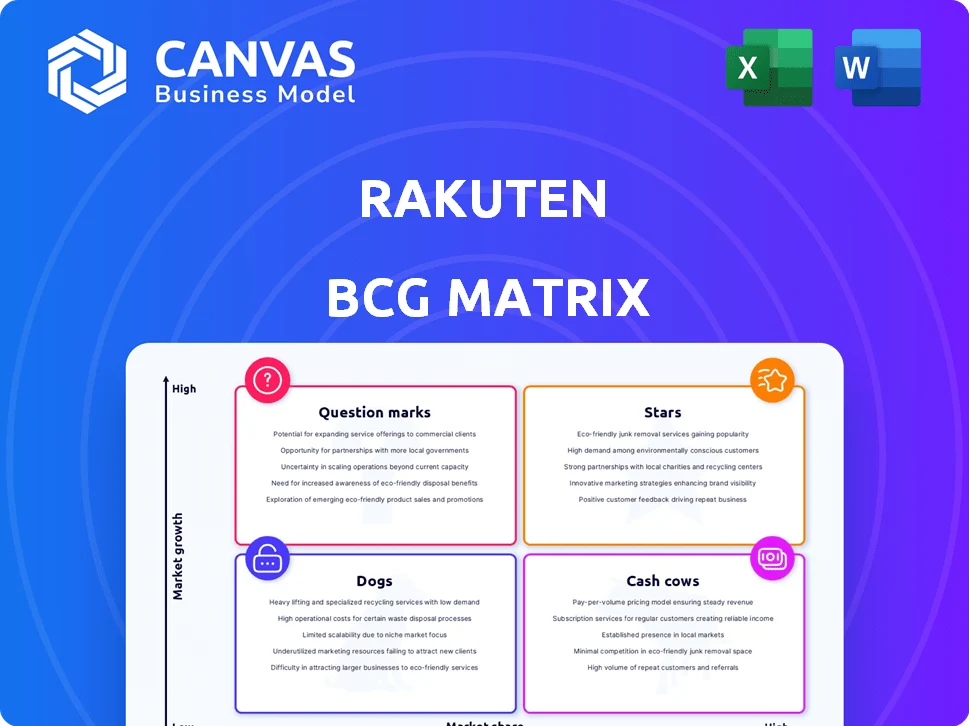
The Rakuten BCG Matrix maps its business units across Stars, Cash Cows, Question Marks, and Dogs to reveal where growth, investment, or divestment is needed-useful for investors and managers alike. This preview highlights key placements and market dynamics; purchase the full BCG Matrix for quadrant-by-quadrant data, actionable strategic moves, and clear capital-allocation guidance you can implement now.
Stars

Rakuten Bank Assets and Customer Growth reaching 16 trillion yen
Rakuten Bank remains the crown jewel of Rakuten's fintech, reaching roughly 16 trillion yen in total assets by late 2025, up about 12% year-on-year and holding a top-three market share in Japan's digital banking segment.
Leveraging the Rakuten ecosystem cut new-customer acquisition costs by an estimated 30% versus megabanks, driving deposits and loan growth while operational metrics show improving cost-to-income ratios near 55% in 2025.
The bank still needs fresh capital to meet regulatory CET1 and liquidity buffers; management flagged additional capital measures in 2025 to support credit expansion and stress-reserve requirements.
Rakuten Card Transaction Volume exceeding 21 trillion yen
As Japan's leading credit card issuer by transaction volume, Rakuten Card recorded over 21 trillion yen in FY2025 transactions, marking ~8% YoY growth and reinforcing its Star status in the BCG matrix.
It bridges commerce and finance by channeling Rakuten Ichiba GMV and grows as Japan pushes toward a 40%+ cashless payment rate by 2025.
The Rakuten Points loyalty integration drives repeat spend-over 500 billion points issued in 2025-creating a durable customer-retention moat competitors struggle to match.

Rakuten Securities Account Numbers surpassing 11 million
Rakuten Securities account numbers topped 11.0 million in FY2025, driven by NISA expansion that lifted new retail inflows by 28% year-over-year to ¥1.2 trillion; the brokerage holds a top-two online market share vs SBI Securities and reported retail trading volume up 34% and asset management AUM at ¥3.8 trillion, keeping it firmly in the BCG Stars quadrant.

Rakuten Symphony Global Telecom Software Contracts
Rakuten Symphony drives Rakuten's high-growth play in global 5G and Open RAN software, leading the shift from hardware with software revenue of ¥58.2bn (FY2025) and 42% YoY growth, despite ¥35bn R&D spend tied to productization.
It captures enterprise and operator B2B deals across 12 countries, underpinning Rakuten's international expansion and representing the primary engine for B2B revenue diversification.
- FY2025 software revenue: ¥58.2bn
- YoY growth: 42%
- R&D investment: ¥35bn
- Global footprint: 12 countries
Rakuten Ichiba Mobile-First GMV Growth
The core Rakuten Ichiba marketplace has re-emerged as a Star after mobile-first integration and AI personalization lifted 2025 GMV to ¥3.2 trillion, up 18% year-over-year, driven by 12 million mobile subscribers averaging 25 transactions annually.
Mobile-driven promotions raised repeat purchase rate to 42% and basket size by 9%, revitalizing domestic commerce growth and improving take-rate economics.
- 2025 GMV: ¥3.2 trillion; +18% YoY
Rakuten's Powerhouses: Banks, Card, Securities, Symphony & Ichiba Fuel 2025 Growth
Stars: Rakuten Bank (¥16T assets, +12% YoY, C/I ~55%), Rakuten Card (¥21T TPV, +8% YoY), Rakuten Securities (11.0M accounts, ¥1.2T new inflows, AUM ¥3.8T), Rakuten Symphony (software ¥58.2B, +42% YoY), Rakuten Ichiba (GMV ¥3.2T, +18% YoY).
| Business | Key 2025 |
|---|---|
| Bank | ¥16T assets |
| Card | ¥21T TPV |
| Securities | 11.0M accts, AUM ¥3.8T |
| Symphony | ¥58.2B software |
| Ichiba | ¥3.2T GMV |
What is included in the product
 Detailed Word Document
Concise BCG analysis of Rakuten's portfolio: quadrant placements, strategic moves (invest/hold/divest), and risks/opportunities per unit.

 Customizable Excel Spreadsheet
One-page overview placing each Rakuten business unit in a quadrant for quick strategic clarity.
Cash Cows

Rakuten Rewards (Formerly Ebates) US Market Share
Rakuten Rewards (formerly Ebates) dominates US cashback with ~45% market share in 2025 and generated approximately $420 million EBITDA in fiscal 2025, reflecting high margins and low capex versus Rakuten Mobile and Rakuten FinTech.
Its mature, low-growth market delivers steady free cash flow-about $320 million in 2025-that Rakuten Group uses to fund mobile and fintech investments, a textbook milking of a successful acquisition.
Rakuten Life Insurance Policyholder Base
Rakuten Life Insurance holds a stable online-savvy base in Japan's mature life market (0-2% growth); FY2025 premiums reached ¥420 billion, with renewal rates ~88% and CAC under ¥5,000 via Rakuten ecosystem, yielding predictable net premiums that helped service Rakuten Group's ¥1.1 trillion corporate debt.

Rakuten Travel Domestic Dominance
Rakuten Travel, one of Japan's top two OTAs, posted ¥48.2 billion operating income in FY2025, benefiting from a mature market and high entry barriers that limit new competitors.
With low incremental capex-under ¥3.5 billion in FY2025-its platform converts peak-season demand into reliable cash flow.

Rakuten Viber Messaging User Base in Eastern Europe
Rakuten Viber holds ~40-55% market share in Southeast Europe and parts of the CIS (2025 regional estimates), keeping monthly active users ~70-90M in Eastern Europe; growth is flat but retention strong, so Viber operates as a cash cow by monetizing ads and business messaging with low incremental capex.
- Regional MAU: 70-90M (2025)
- Market share: ~40-55% in SE Europe/CIS (2025)
- Revenue mix: ad + RBM (business messaging) >60%
- Capex intensity: low vs. revenue; high operating margins
Rakuten Points Loyalty Program Ecosystem
Rakuten Points locks users into Rakuten's ecosystem, cutting churn and driving repeat spend; in FY2025 Rakuten issued over 450 billion points and saw ~70% of point redemptions occur within its marketplace, boosting gross merchandise value.
The program's scale-over 110 million members in Japan by 2025-pushes high customer lifetime value and low marginal marketing costs, making it a cash cow for Rakuten.
- 450+ billion points issued (FY2025)
- ~70% redemptions inside Rakuten marketplace
- 110M+ Japan members (2025)
- Higher CLV, lower churn, marketing efficiency
Rakuten 2025: Strong cash flow, scale in rewards, insurance, travel, Viber & points
Rakuten Rewards: $420M EBITDA, $320M FCF, ~45% US cashback share (FY2025). Rakuten Life: ¥420B premiums, 88% renewal, CAC <¥5,000 (FY2025). Rakuten Travel: ¥48.2B operating income, capex <¥3.5B (FY2025). Viber: 70-90M MAU, 40-55% regional share (2025). Points: 450B issued, 70% internal redemption, 110M Japan members (2025).
| Asset | Key 2025 metrics |
|---|---|
| Rakuten Rewards | $420M EBITDA; $320M FCF; 45% US share |
| Rakuten Life | ¥420B premiums; 88% renewals; CAC <¥5,000 |
| Rakuten Travel | ¥48.2B op. income; capex <¥3.5B |
| Viber | 70-90M MAU; 40-55% regional share |
| Rakuten Points | 450B issued; 70% internal redemptions; 110M members |
Preview = Final Product
Rakuten BCG Matrix
The file you're previewing is the exact Rakuten BCG Matrix report you'll receive after purchase-no watermarks, no placeholders-just a fully formatted, ready-to-use strategic analysis tailored for clarity and decision-making.
This preview matches the downloadable file you'll get: expert-crafted content with market-aligned positioning and financial context, delivered straight to your inbox with no surprises or additional edits required.
What you see is the final, editable BCG Matrix-immediately usable for presentations, planning sessions, or investor materials once purchased, with professional layout and clear data points.
You're viewing the actual product that becomes yours after a one-time purchase: a polished, analysis-ready Rakuten BCG Matrix designed to slot directly into your strategy workflow.

Original: $10.00
-65%$10.00
$3.50RAKUTEN BCG MATRIX TEMPLATE RESEARCH
Unlock Strategic Clarity
The Rakuten BCG Matrix maps its business units across Stars, Cash Cows, Question Marks, and Dogs to reveal where growth, investment, or divestment is needed-useful for investors and managers alike. This preview highlights key placements and market dynamics; purchase the full BCG Matrix for quadrant-by-quadrant data, actionable strategic moves, and clear capital-allocation guidance you can implement now.
Stars
Rakuten Bank Assets and Customer Growth reaching 16 trillion yen
Rakuten Bank remains the crown jewel of Rakuten's fintech, reaching roughly 16 trillion yen in total assets by late 2025, up about 12% year-on-year and holding a top-three market share in Japan's digital banking segment.
Leveraging the Rakuten ecosystem cut new-customer acquisition costs by an estimated 30% versus megabanks, driving deposits and loan growth while operational metrics show improving cost-to-income ratios near 55% in 2025.
The bank still needs fresh capital to meet regulatory CET1 and liquidity buffers; management flagged additional capital measures in 2025 to support credit expansion and stress-reserve requirements.
Rakuten Card Transaction Volume exceeding 21 trillion yen
As Japan's leading credit card issuer by transaction volume, Rakuten Card recorded over 21 trillion yen in FY2025 transactions, marking ~8% YoY growth and reinforcing its Star status in the BCG matrix.
It bridges commerce and finance by channeling Rakuten Ichiba GMV and grows as Japan pushes toward a 40%+ cashless payment rate by 2025.
The Rakuten Points loyalty integration drives repeat spend-over 500 billion points issued in 2025-creating a durable customer-retention moat competitors struggle to match.
Rakuten Securities Account Numbers surpassing 11 million
Rakuten Securities account numbers topped 11.0 million in FY2025, driven by NISA expansion that lifted new retail inflows by 28% year-over-year to ¥1.2 trillion; the brokerage holds a top-two online market share vs SBI Securities and reported retail trading volume up 34% and asset management AUM at ¥3.8 trillion, keeping it firmly in the BCG Stars quadrant.
Rakuten Symphony Global Telecom Software Contracts
Rakuten Symphony drives Rakuten's high-growth play in global 5G and Open RAN software, leading the shift from hardware with software revenue of ¥58.2bn (FY2025) and 42% YoY growth, despite ¥35bn R&D spend tied to productization.
It captures enterprise and operator B2B deals across 12 countries, underpinning Rakuten's international expansion and representing the primary engine for B2B revenue diversification.
- FY2025 software revenue: ¥58.2bn
- YoY growth: 42%
- R&D investment: ¥35bn
- Global footprint: 12 countries
Rakuten Ichiba Mobile-First GMV Growth
The core Rakuten Ichiba marketplace has re-emerged as a Star after mobile-first integration and AI personalization lifted 2025 GMV to ¥3.2 trillion, up 18% year-over-year, driven by 12 million mobile subscribers averaging 25 transactions annually.
Mobile-driven promotions raised repeat purchase rate to 42% and basket size by 9%, revitalizing domestic commerce growth and improving take-rate economics.
- 2025 GMV: ¥3.2 trillion; +18% YoY
Rakuten's Powerhouses: Banks, Card, Securities, Symphony & Ichiba Fuel 2025 Growth
Stars: Rakuten Bank (¥16T assets, +12% YoY, C/I ~55%), Rakuten Card (¥21T TPV, +8% YoY), Rakuten Securities (11.0M accounts, ¥1.2T new inflows, AUM ¥3.8T), Rakuten Symphony (software ¥58.2B, +42% YoY), Rakuten Ichiba (GMV ¥3.2T, +18% YoY).
| Business | Key 2025 |
|---|---|
| Bank | ¥16T assets |
| Card | ¥21T TPV |
| Securities | 11.0M accts, AUM ¥3.8T |
| Symphony | ¥58.2B software |
| Ichiba | ¥3.2T GMV |
What is included in the product
Detailed Word Document
Concise BCG analysis of Rakuten's portfolio: quadrant placements, strategic moves (invest/hold/divest), and risks/opportunities per unit.
Customizable Excel Spreadsheet
One-page overview placing each Rakuten business unit in a quadrant for quick strategic clarity.
Cash Cows
Rakuten Rewards (Formerly Ebates) US Market Share
Rakuten Rewards (formerly Ebates) dominates US cashback with ~45% market share in 2025 and generated approximately $420 million EBITDA in fiscal 2025, reflecting high margins and low capex versus Rakuten Mobile and Rakuten FinTech.
Its mature, low-growth market delivers steady free cash flow-about $320 million in 2025-that Rakuten Group uses to fund mobile and fintech investments, a textbook milking of a successful acquisition.
Rakuten Life Insurance Policyholder Base
Rakuten Life Insurance holds a stable online-savvy base in Japan's mature life market (0-2% growth); FY2025 premiums reached ¥420 billion, with renewal rates ~88% and CAC under ¥5,000 via Rakuten ecosystem, yielding predictable net premiums that helped service Rakuten Group's ¥1.1 trillion corporate debt.
Rakuten Travel Domestic Dominance
Rakuten Travel, one of Japan's top two OTAs, posted ¥48.2 billion operating income in FY2025, benefiting from a mature market and high entry barriers that limit new competitors.
With low incremental capex-under ¥3.5 billion in FY2025-its platform converts peak-season demand into reliable cash flow.
Rakuten Viber Messaging User Base in Eastern Europe
Rakuten Viber holds ~40-55% market share in Southeast Europe and parts of the CIS (2025 regional estimates), keeping monthly active users ~70-90M in Eastern Europe; growth is flat but retention strong, so Viber operates as a cash cow by monetizing ads and business messaging with low incremental capex.
- Regional MAU: 70-90M (2025)
- Market share: ~40-55% in SE Europe/CIS (2025)
- Revenue mix: ad + RBM (business messaging) >60%
- Capex intensity: low vs. revenue; high operating margins
Rakuten Points Loyalty Program Ecosystem
Rakuten Points locks users into Rakuten's ecosystem, cutting churn and driving repeat spend; in FY2025 Rakuten issued over 450 billion points and saw ~70% of point redemptions occur within its marketplace, boosting gross merchandise value.
The program's scale-over 110 million members in Japan by 2025-pushes high customer lifetime value and low marginal marketing costs, making it a cash cow for Rakuten.
- 450+ billion points issued (FY2025)
- ~70% redemptions inside Rakuten marketplace
- 110M+ Japan members (2025)
- Higher CLV, lower churn, marketing efficiency
Rakuten 2025: Strong cash flow, scale in rewards, insurance, travel, Viber & points
Rakuten Rewards: $420M EBITDA, $320M FCF, ~45% US cashback share (FY2025). Rakuten Life: ¥420B premiums, 88% renewal, CAC <¥5,000 (FY2025). Rakuten Travel: ¥48.2B operating income, capex <¥3.5B (FY2025). Viber: 70-90M MAU, 40-55% regional share (2025). Points: 450B issued, 70% internal redemption, 110M Japan members (2025).
| Asset | Key 2025 metrics |
|---|---|
| Rakuten Rewards | $420M EBITDA; $320M FCF; 45% US share |
| Rakuten Life | ¥420B premiums; 88% renewals; CAC <¥5,000 |
| Rakuten Travel | ¥48.2B op. income; capex <¥3.5B |
| Viber | 70-90M MAU; 40-55% regional share |
| Rakuten Points | 450B issued; 70% internal redemptions; 110M members |
Preview = Final Product
Rakuten BCG Matrix
The file you're previewing is the exact Rakuten BCG Matrix report you'll receive after purchase-no watermarks, no placeholders-just a fully formatted, ready-to-use strategic analysis tailored for clarity and decision-making.
This preview matches the downloadable file you'll get: expert-crafted content with market-aligned positioning and financial context, delivered straight to your inbox with no surprises or additional edits required.
What you see is the final, editable BCG Matrix-immediately usable for presentations, planning sessions, or investor materials once purchased, with professional layout and clear data points.
You're viewing the actual product that becomes yours after a one-time purchase: a polished, analysis-ready Rakuten BCG Matrix designed to slot directly into your strategy workflow.
Product Information
Product Information
Shipping & Returns
Shipping & Returns
Description
Unlock Strategic Clarity
The Rakuten BCG Matrix maps its business units across Stars, Cash Cows, Question Marks, and Dogs to reveal where growth, investment, or divestment is needed-useful for investors and managers alike. This preview highlights key placements and market dynamics; purchase the full BCG Matrix for quadrant-by-quadrant data, actionable strategic moves, and clear capital-allocation guidance you can implement now.
Stars
Rakuten Bank Assets and Customer Growth reaching 16 trillion yen
Rakuten Bank remains the crown jewel of Rakuten's fintech, reaching roughly 16 trillion yen in total assets by late 2025, up about 12% year-on-year and holding a top-three market share in Japan's digital banking segment.
Leveraging the Rakuten ecosystem cut new-customer acquisition costs by an estimated 30% versus megabanks, driving deposits and loan growth while operational metrics show improving cost-to-income ratios near 55% in 2025.
The bank still needs fresh capital to meet regulatory CET1 and liquidity buffers; management flagged additional capital measures in 2025 to support credit expansion and stress-reserve requirements.
Rakuten Card Transaction Volume exceeding 21 trillion yen
As Japan's leading credit card issuer by transaction volume, Rakuten Card recorded over 21 trillion yen in FY2025 transactions, marking ~8% YoY growth and reinforcing its Star status in the BCG matrix.
It bridges commerce and finance by channeling Rakuten Ichiba GMV and grows as Japan pushes toward a 40%+ cashless payment rate by 2025.
The Rakuten Points loyalty integration drives repeat spend-over 500 billion points issued in 2025-creating a durable customer-retention moat competitors struggle to match.
Rakuten Securities Account Numbers surpassing 11 million
Rakuten Securities account numbers topped 11.0 million in FY2025, driven by NISA expansion that lifted new retail inflows by 28% year-over-year to ¥1.2 trillion; the brokerage holds a top-two online market share vs SBI Securities and reported retail trading volume up 34% and asset management AUM at ¥3.8 trillion, keeping it firmly in the BCG Stars quadrant.
Rakuten Symphony Global Telecom Software Contracts
Rakuten Symphony drives Rakuten's high-growth play in global 5G and Open RAN software, leading the shift from hardware with software revenue of ¥58.2bn (FY2025) and 42% YoY growth, despite ¥35bn R&D spend tied to productization.
It captures enterprise and operator B2B deals across 12 countries, underpinning Rakuten's international expansion and representing the primary engine for B2B revenue diversification.
- FY2025 software revenue: ¥58.2bn
- YoY growth: 42%
- R&D investment: ¥35bn
- Global footprint: 12 countries
Rakuten Ichiba Mobile-First GMV Growth
The core Rakuten Ichiba marketplace has re-emerged as a Star after mobile-first integration and AI personalization lifted 2025 GMV to ¥3.2 trillion, up 18% year-over-year, driven by 12 million mobile subscribers averaging 25 transactions annually.
Mobile-driven promotions raised repeat purchase rate to 42% and basket size by 9%, revitalizing domestic commerce growth and improving take-rate economics.
- 2025 GMV: ¥3.2 trillion; +18% YoY
Rakuten's Powerhouses: Banks, Card, Securities, Symphony & Ichiba Fuel 2025 Growth
Stars: Rakuten Bank (¥16T assets, +12% YoY, C/I ~55%), Rakuten Card (¥21T TPV, +8% YoY), Rakuten Securities (11.0M accounts, ¥1.2T new inflows, AUM ¥3.8T), Rakuten Symphony (software ¥58.2B, +42% YoY), Rakuten Ichiba (GMV ¥3.2T, +18% YoY).
| Business | Key 2025 |
|---|---|
| Bank | ¥16T assets |
| Card | ¥21T TPV |
| Securities | 11.0M accts, AUM ¥3.8T |
| Symphony | ¥58.2B software |
| Ichiba | ¥3.2T GMV |
What is included in the product
Detailed Word Document
Concise BCG analysis of Rakuten's portfolio: quadrant placements, strategic moves (invest/hold/divest), and risks/opportunities per unit.
Customizable Excel Spreadsheet
One-page overview placing each Rakuten business unit in a quadrant for quick strategic clarity.
Cash Cows
Rakuten Rewards (Formerly Ebates) US Market Share
Rakuten Rewards (formerly Ebates) dominates US cashback with ~45% market share in 2025 and generated approximately $420 million EBITDA in fiscal 2025, reflecting high margins and low capex versus Rakuten Mobile and Rakuten FinTech.
Its mature, low-growth market delivers steady free cash flow-about $320 million in 2025-that Rakuten Group uses to fund mobile and fintech investments, a textbook milking of a successful acquisition.
Rakuten Life Insurance Policyholder Base
Rakuten Life Insurance holds a stable online-savvy base in Japan's mature life market (0-2% growth); FY2025 premiums reached ¥420 billion, with renewal rates ~88% and CAC under ¥5,000 via Rakuten ecosystem, yielding predictable net premiums that helped service Rakuten Group's ¥1.1 trillion corporate debt.
Rakuten Travel Domestic Dominance
Rakuten Travel, one of Japan's top two OTAs, posted ¥48.2 billion operating income in FY2025, benefiting from a mature market and high entry barriers that limit new competitors.
With low incremental capex-under ¥3.5 billion in FY2025-its platform converts peak-season demand into reliable cash flow.
Rakuten Viber Messaging User Base in Eastern Europe
Rakuten Viber holds ~40-55% market share in Southeast Europe and parts of the CIS (2025 regional estimates), keeping monthly active users ~70-90M in Eastern Europe; growth is flat but retention strong, so Viber operates as a cash cow by monetizing ads and business messaging with low incremental capex.
- Regional MAU: 70-90M (2025)
- Market share: ~40-55% in SE Europe/CIS (2025)
- Revenue mix: ad + RBM (business messaging) >60%
- Capex intensity: low vs. revenue; high operating margins
Rakuten Points Loyalty Program Ecosystem
Rakuten Points locks users into Rakuten's ecosystem, cutting churn and driving repeat spend; in FY2025 Rakuten issued over 450 billion points and saw ~70% of point redemptions occur within its marketplace, boosting gross merchandise value.
The program's scale-over 110 million members in Japan by 2025-pushes high customer lifetime value and low marginal marketing costs, making it a cash cow for Rakuten.
- 450+ billion points issued (FY2025)
- ~70% redemptions inside Rakuten marketplace
- 110M+ Japan members (2025)
- Higher CLV, lower churn, marketing efficiency
Rakuten 2025: Strong cash flow, scale in rewards, insurance, travel, Viber & points
Rakuten Rewards: $420M EBITDA, $320M FCF, ~45% US cashback share (FY2025). Rakuten Life: ¥420B premiums, 88% renewal, CAC <¥5,000 (FY2025). Rakuten Travel: ¥48.2B operating income, capex <¥3.5B (FY2025). Viber: 70-90M MAU, 40-55% regional share (2025). Points: 450B issued, 70% internal redemption, 110M Japan members (2025).
| Asset | Key 2025 metrics |
|---|---|
| Rakuten Rewards | $420M EBITDA; $320M FCF; 45% US share |
| Rakuten Life | ¥420B premiums; 88% renewals; CAC <¥5,000 |
| Rakuten Travel | ¥48.2B op. income; capex <¥3.5B |
| Viber | 70-90M MAU; 40-55% regional share |
| Rakuten Points | 450B issued; 70% internal redemptions; 110M members |
Preview = Final Product
Rakuten BCG Matrix
The file you're previewing is the exact Rakuten BCG Matrix report you'll receive after purchase-no watermarks, no placeholders-just a fully formatted, ready-to-use strategic analysis tailored for clarity and decision-making.
This preview matches the downloadable file you'll get: expert-crafted content with market-aligned positioning and financial context, delivered straight to your inbox with no surprises or additional edits required.
What you see is the final, editable BCG Matrix-immediately usable for presentations, planning sessions, or investor materials once purchased, with professional layout and clear data points.
You're viewing the actual product that becomes yours after a one-time purchase: a polished, analysis-ready Rakuten BCG Matrix designed to slot directly into your strategy workflow.









