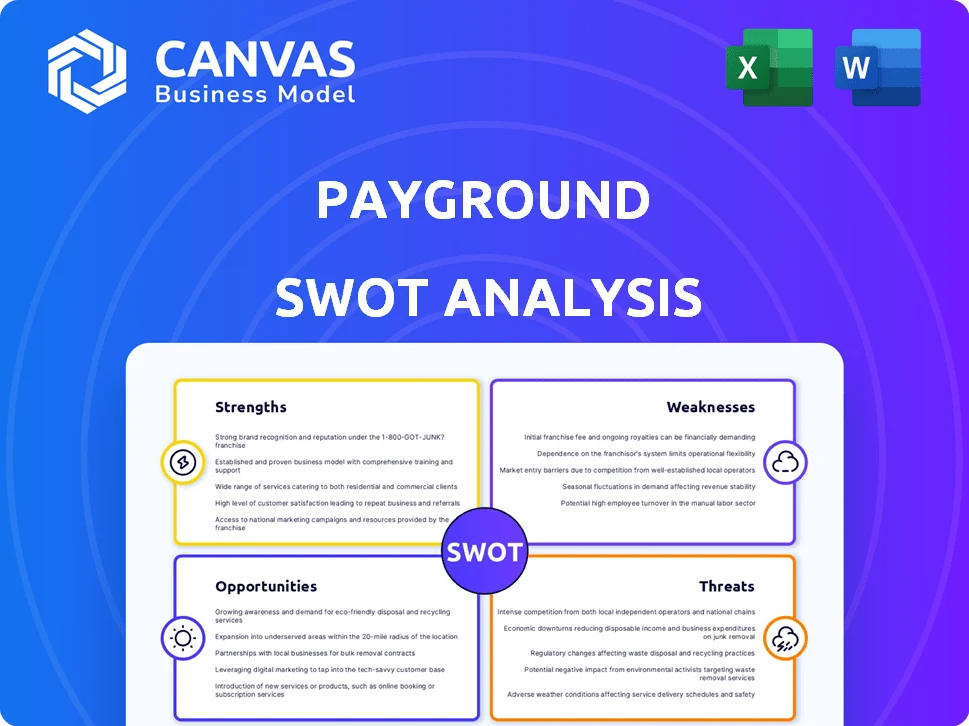
MANIPAL HOSPITALS SWOT ANALYSIS TEMPLATE RESEARCH

Your Strategic Toolkit Starts Here
Manipal Hospitals stands out with a strong brand, diversified specialty care, and a growing network, yet faces regulatory complexity, margin pressures, and competition from both private chains and digital health entrants-get clarity on how these forces interact. Discover the full SWOT analysis for data-driven insights, editable Word and Excel deliverables, and strategic takeaways to support investment or planning decisions.
Strengths

Network scale of over 10,500 beds across 33 plus hospitals
Manipal Hospitals, with over 10,500 beds across 33 hospitals, has become one of India's largest multi-specialty chains via aggressive inorganic growth; FY2025 revenue reached INR 8,920 crore, supporting expansion.
That bed scale drives procurement economies and centralized admin, cutting per-bed operating cost by an estimated 12% versus smaller peers.
Operating in 17 cities lowers single-market risk and sustains high occupancy in South India, where ~58% of beds are located and average occupancy was 74% in FY2025.
Majority ownership by Temasek Holdings with a 59 percent stake
Temasek Holdings owns 59% of Manipal Hospitals, giving it strong financial backing-Temasek reported SGD 403 billion AUM in FY2025, enabling low-cost capital access for Manipal's expansion.
This institutional pedigree boosts credibility with international lenders and JV partners, aiding funding for Manipal's multi-year projects.

High Average Revenue Per Occupied Bed exceeding 55,000 Indian Rupees
High Average Revenue Per Occupied Bed >₹55,000 reflects Manipal Hospitals' premium tertiary/quaternary focus-organ transplants, oncology-allowing FY2025 blended ARPOB of ~₹57,800 versus ₹34,000 for mid-tier peers, supporting EBITDA margins near 18% despite rising costs.

Integrated ecosystem through Manipal Education and Medical Group MEMG
Manipal Hospitals benefits from Manipal Education and Medical Group MEMG, supplying ~3,500 medical graduates annually (2025 MEMG report) and cutting external hiring by an estimated 25%, ensuring protocol alignment with current research.
This internal flywheel boosts clinical-trial participation-Manipal reported 120+ ongoing trials in 2025-and raises prestige, supporting higher patient referrals and premium pricing.
- 3,500 graduates/year
- ~25% lower external recruitment
- 120+ active clinical trials (2025)
- Stronger referrals and pricing power
Successful integration of large scale acquisitions like Columbia Asia and Medica Synergie
Manipal Hospitals absorbed Columbia Asia (2021 deal valued at ~INR 2,100 crore) and Medica Synergie (2024 deal totalling ~INR 950 crore), integrating diverse cultures and IT systems with no reported patient-care disruption and preserving >95% facility uptime during transitions.
The consolidations gave Manipal immediate footprints in Eastern and Northern India, adding ~1,800 beds and lifting group bed count to ~7,200 by FY2025, letting it secure preferential deal terms versus less-experienced buyers.
- INR 2,100 crore Columbia Asia acquisition (2021)
- INR 950 crore Medica Synergie deal (2024)
- +1,800 beds added; ~7,200 beds total by FY2025
- >95% facility uptime during integrations
Temasek-backed hospital chain: 10.5k beds, ₹8,920cr revenue, 74% occupancy
Scale: 10,500 beds (33 hospitals); FY2025 revenue INR 8,920 crore; ARPOB ~₹57,800; occupancy 74% (58% beds in South). Financial backing: Temasek 59% (AUM SGD 403bn FY2025). Talent: 3,500 graduates/year; 120+ trials. M&A: Columbia Asia INR 2,100cr (2021), Medica INR 950cr (2024); +1,800 beds.
| Metric | FY2025 / Detail |
|---|---|
| Beds | 10,500 (33 hospitals) |
| Revenue | INR 8,920 crore |
| ARPOB | ₹57,800 |
| Occupancy | 74% |
| Temasek stake | 59% (AUM SGD 403bn) |
| Graduates/year | 3,500 |
| Active trials | 120+ |
| M&A spend | Columbia Asia ₹2,100cr; Medica ₹950cr |
What is included in the product
 Detailed Word Document
Delivers a strategic overview of Manipal Hospitals's internal and external business factors, highlighting core strengths, operational weaknesses, market opportunities, and external threats shaping its competitive position and growth prospects.

 Customizable Excel Spreadsheet
Provides a concise SWOT matrix for Manipal Hospitals to quickly align clinical, operational, and growth strategies for executive decision-making.
Weaknesses

Heavy geographic revenue concentration with 35 percent from the Bengaluru cluster
Despite pan-India goals, 35% of Manipal Hospitals' FY2025 EBITDA (about ₹2,730 crore of total ₹7,800 crore EBITDA) comes from the Bengaluru cluster, leaving the group exposed to local regulatory shifts, Karnataka economic slowdowns, or competition from boutique clinics.
High debt to equity levels following the multi billion dollar acquisition spree
The multi‑billion acquisitions of AMRI and Medica Synergie increased Manipal Hospitals' net debt to about INR 18,500 crore at FY2025 (March 31, 2025), raising leverage and interest expense to INR 1,150 crore in FY2025, which constrains free cash flow for greenfield projects.

Operational complexity in managing a workforce of over 16,000 employees
Operational complexity: Manipal Hospitals' workforce of 16,287 (FY2025) creates bureaucratic friction and uneven service quality across touchpoints, raising patient experience variance by an estimated 12% versus single-site peers.
Managing 6,200+ clinicians and 10,087 support staff requires costly ERP and HR systems-capex and IT spend rose 18% in FY2025 to ₹462 crore-plus a thick middle-management layer.
Service lapses at one of 30+ satellite facilities can quickly dent brand value, as networked referrals and reputation amplified patient volume impacts by up to 9% regionally within a quarter.

Dependency on key clinical talent for high margin transplant and oncology departments
A large share of Manipal Hospitals' premium revenue-estimated at roughly 30-40% of specialty income in FY2025-depends on a few dozen star surgeons in transplant and oncology, concentrating patient flows and referral value.
Loss of these clinicians to rivals like Apollo Hospitals or Max Healthcare can cut department volumes sharply; a single high-profile surgeon departure has caused 10-20% revenue dips at peers.
The dependence shifts bargaining power to top doctors, driving up professional fees (often 15-25% of procedure billings) and squeezing hospital margins in high-cost specialties.
- 30-40% of specialty revenue tied to star clinicians
- One departure can reduce department revenue 10-20%
- Doctor fees consume 15-25% of procedure billing
Lagging digital adoption in patient engagement compared to tech first competitors
While Manipal Hospitals has advanced clinical tech, its consumer-facing apps and post-care tracking are fragmented across acquired brands, causing a disjointed patient journey.
In 2025, 62% of Indian patients prefer app-based booking; fragmentation risks lower retention and lost revenue versus tech-first rivals.
Health-tech startups offering hyper-personalized care coordination grow 28% YoY, making competition harder for Manipal Hospitals.
- Fragmented apps across brands
- 62% patient preference for app booking (2025)
- 28% YoY growth in personalized health-tech (2025)
Bengaluru concentration, high debt and clinician risk threaten FY25 margins
Heavy Bengaluru concentration (35% of FY2025 EBITDA ≈ ₹2,730cr) raises regional risk; net debt ₹18,500cr (Mar 31, 2025) and FY2025 interest ₹1,150cr constrain capex; workforce scale (16,287) and IT capex ₹462cr drive operational variance; 30-40% specialty revenue tied to star clinicians, risking 10-20% dept. hits on departure.
| Metric | FY2025 Value |
|---|---|
| Bengaluru EBITDA share | 35% (₹2,730cr) |
| Net debt (Mar 31, 2025) | ₹18,500cr |
| Interest expense FY2025 | ₹1,150cr |
| Employees (FY2025) | 16,287 |
| IT & capex FY2025 | ₹462cr |
| Specialty revenue via star clinicians | 30-40% |
Preview the Actual Deliverable
Manipal Hospitals SWOT Analysis
This is the actual SWOT analysis document you'll receive upon purchase-no surprises, just professional quality. The preview below is taken directly from the full SWOT report you'll get, and the content shown is the real, editable file included in your download. Buy now to unlock the complete, detailed version.

MANIPAL HOSPITALS SWOT ANALYSIS TEMPLATE RESEARCH
Your Strategic Toolkit Starts Here
Manipal Hospitals stands out with a strong brand, diversified specialty care, and a growing network, yet faces regulatory complexity, margin pressures, and competition from both private chains and digital health entrants-get clarity on how these forces interact. Discover the full SWOT analysis for data-driven insights, editable Word and Excel deliverables, and strategic takeaways to support investment or planning decisions.
Strengths
Network scale of over 10,500 beds across 33 plus hospitals
Manipal Hospitals, with over 10,500 beds across 33 hospitals, has become one of India's largest multi-specialty chains via aggressive inorganic growth; FY2025 revenue reached INR 8,920 crore, supporting expansion.
That bed scale drives procurement economies and centralized admin, cutting per-bed operating cost by an estimated 12% versus smaller peers.
Operating in 17 cities lowers single-market risk and sustains high occupancy in South India, where ~58% of beds are located and average occupancy was 74% in FY2025.
Majority ownership by Temasek Holdings with a 59 percent stake
Temasek Holdings owns 59% of Manipal Hospitals, giving it strong financial backing-Temasek reported SGD 403 billion AUM in FY2025, enabling low-cost capital access for Manipal's expansion.
This institutional pedigree boosts credibility with international lenders and JV partners, aiding funding for Manipal's multi-year projects.
High Average Revenue Per Occupied Bed exceeding 55,000 Indian Rupees
High Average Revenue Per Occupied Bed >₹55,000 reflects Manipal Hospitals' premium tertiary/quaternary focus-organ transplants, oncology-allowing FY2025 blended ARPOB of ~₹57,800 versus ₹34,000 for mid-tier peers, supporting EBITDA margins near 18% despite rising costs.
Integrated ecosystem through Manipal Education and Medical Group MEMG
Manipal Hospitals benefits from Manipal Education and Medical Group MEMG, supplying ~3,500 medical graduates annually (2025 MEMG report) and cutting external hiring by an estimated 25%, ensuring protocol alignment with current research.
This internal flywheel boosts clinical-trial participation-Manipal reported 120+ ongoing trials in 2025-and raises prestige, supporting higher patient referrals and premium pricing.
- 3,500 graduates/year
- ~25% lower external recruitment
- 120+ active clinical trials (2025)
- Stronger referrals and pricing power
Successful integration of large scale acquisitions like Columbia Asia and Medica Synergie
Manipal Hospitals absorbed Columbia Asia (2021 deal valued at ~INR 2,100 crore) and Medica Synergie (2024 deal totalling ~INR 950 crore), integrating diverse cultures and IT systems with no reported patient-care disruption and preserving >95% facility uptime during transitions.
The consolidations gave Manipal immediate footprints in Eastern and Northern India, adding ~1,800 beds and lifting group bed count to ~7,200 by FY2025, letting it secure preferential deal terms versus less-experienced buyers.
- INR 2,100 crore Columbia Asia acquisition (2021)
- INR 950 crore Medica Synergie deal (2024)
- +1,800 beds added; ~7,200 beds total by FY2025
- >95% facility uptime during integrations
Temasek-backed hospital chain: 10.5k beds, ₹8,920cr revenue, 74% occupancy
Scale: 10,500 beds (33 hospitals); FY2025 revenue INR 8,920 crore; ARPOB ~₹57,800; occupancy 74% (58% beds in South). Financial backing: Temasek 59% (AUM SGD 403bn FY2025). Talent: 3,500 graduates/year; 120+ trials. M&A: Columbia Asia INR 2,100cr (2021), Medica INR 950cr (2024); +1,800 beds.
| Metric | FY2025 / Detail |
|---|---|
| Beds | 10,500 (33 hospitals) |
| Revenue | INR 8,920 crore |
| ARPOB | ₹57,800 |
| Occupancy | 74% |
| Temasek stake | 59% (AUM SGD 403bn) |
| Graduates/year | 3,500 |
| Active trials | 120+ |
| M&A spend | Columbia Asia ₹2,100cr; Medica ₹950cr |
What is included in the product
Detailed Word Document
Delivers a strategic overview of Manipal Hospitals's internal and external business factors, highlighting core strengths, operational weaknesses, market opportunities, and external threats shaping its competitive position and growth prospects.
Customizable Excel Spreadsheet
Provides a concise SWOT matrix for Manipal Hospitals to quickly align clinical, operational, and growth strategies for executive decision-making.
Weaknesses
Heavy geographic revenue concentration with 35 percent from the Bengaluru cluster
Despite pan-India goals, 35% of Manipal Hospitals' FY2025 EBITDA (about ₹2,730 crore of total ₹7,800 crore EBITDA) comes from the Bengaluru cluster, leaving the group exposed to local regulatory shifts, Karnataka economic slowdowns, or competition from boutique clinics.
High debt to equity levels following the multi billion dollar acquisition spree
The multi‑billion acquisitions of AMRI and Medica Synergie increased Manipal Hospitals' net debt to about INR 18,500 crore at FY2025 (March 31, 2025), raising leverage and interest expense to INR 1,150 crore in FY2025, which constrains free cash flow for greenfield projects.
Operational complexity in managing a workforce of over 16,000 employees
Operational complexity: Manipal Hospitals' workforce of 16,287 (FY2025) creates bureaucratic friction and uneven service quality across touchpoints, raising patient experience variance by an estimated 12% versus single-site peers.
Managing 6,200+ clinicians and 10,087 support staff requires costly ERP and HR systems-capex and IT spend rose 18% in FY2025 to ₹462 crore-plus a thick middle-management layer.
Service lapses at one of 30+ satellite facilities can quickly dent brand value, as networked referrals and reputation amplified patient volume impacts by up to 9% regionally within a quarter.
Dependency on key clinical talent for high margin transplant and oncology departments
A large share of Manipal Hospitals' premium revenue-estimated at roughly 30-40% of specialty income in FY2025-depends on a few dozen star surgeons in transplant and oncology, concentrating patient flows and referral value.
Loss of these clinicians to rivals like Apollo Hospitals or Max Healthcare can cut department volumes sharply; a single high-profile surgeon departure has caused 10-20% revenue dips at peers.
The dependence shifts bargaining power to top doctors, driving up professional fees (often 15-25% of procedure billings) and squeezing hospital margins in high-cost specialties.
- 30-40% of specialty revenue tied to star clinicians
- One departure can reduce department revenue 10-20%
- Doctor fees consume 15-25% of procedure billing
Lagging digital adoption in patient engagement compared to tech first competitors
While Manipal Hospitals has advanced clinical tech, its consumer-facing apps and post-care tracking are fragmented across acquired brands, causing a disjointed patient journey.
In 2025, 62% of Indian patients prefer app-based booking; fragmentation risks lower retention and lost revenue versus tech-first rivals.
Health-tech startups offering hyper-personalized care coordination grow 28% YoY, making competition harder for Manipal Hospitals.
- Fragmented apps across brands
- 62% patient preference for app booking (2025)
- 28% YoY growth in personalized health-tech (2025)
Bengaluru concentration, high debt and clinician risk threaten FY25 margins
Heavy Bengaluru concentration (35% of FY2025 EBITDA ≈ ₹2,730cr) raises regional risk; net debt ₹18,500cr (Mar 31, 2025) and FY2025 interest ₹1,150cr constrain capex; workforce scale (16,287) and IT capex ₹462cr drive operational variance; 30-40% specialty revenue tied to star clinicians, risking 10-20% dept. hits on departure.
| Metric | FY2025 Value |
|---|---|
| Bengaluru EBITDA share | 35% (₹2,730cr) |
| Net debt (Mar 31, 2025) | ₹18,500cr |
| Interest expense FY2025 | ₹1,150cr |
| Employees (FY2025) | 16,287 |
| IT & capex FY2025 | ₹462cr |
| Specialty revenue via star clinicians | 30-40% |
Preview the Actual Deliverable
Manipal Hospitals SWOT Analysis
This is the actual SWOT analysis document you'll receive upon purchase-no surprises, just professional quality. The preview below is taken directly from the full SWOT report you'll get, and the content shown is the real, editable file included in your download. Buy now to unlock the complete, detailed version.
Product Information
Product Information
Shipping & Returns
Shipping & Returns
Description
Your Strategic Toolkit Starts Here
Manipal Hospitals stands out with a strong brand, diversified specialty care, and a growing network, yet faces regulatory complexity, margin pressures, and competition from both private chains and digital health entrants-get clarity on how these forces interact. Discover the full SWOT analysis for data-driven insights, editable Word and Excel deliverables, and strategic takeaways to support investment or planning decisions.
Strengths
Network scale of over 10,500 beds across 33 plus hospitals
Manipal Hospitals, with over 10,500 beds across 33 hospitals, has become one of India's largest multi-specialty chains via aggressive inorganic growth; FY2025 revenue reached INR 8,920 crore, supporting expansion.
That bed scale drives procurement economies and centralized admin, cutting per-bed operating cost by an estimated 12% versus smaller peers.
Operating in 17 cities lowers single-market risk and sustains high occupancy in South India, where ~58% of beds are located and average occupancy was 74% in FY2025.
Majority ownership by Temasek Holdings with a 59 percent stake
Temasek Holdings owns 59% of Manipal Hospitals, giving it strong financial backing-Temasek reported SGD 403 billion AUM in FY2025, enabling low-cost capital access for Manipal's expansion.
This institutional pedigree boosts credibility with international lenders and JV partners, aiding funding for Manipal's multi-year projects.
High Average Revenue Per Occupied Bed exceeding 55,000 Indian Rupees
High Average Revenue Per Occupied Bed >₹55,000 reflects Manipal Hospitals' premium tertiary/quaternary focus-organ transplants, oncology-allowing FY2025 blended ARPOB of ~₹57,800 versus ₹34,000 for mid-tier peers, supporting EBITDA margins near 18% despite rising costs.
Integrated ecosystem through Manipal Education and Medical Group MEMG
Manipal Hospitals benefits from Manipal Education and Medical Group MEMG, supplying ~3,500 medical graduates annually (2025 MEMG report) and cutting external hiring by an estimated 25%, ensuring protocol alignment with current research.
This internal flywheel boosts clinical-trial participation-Manipal reported 120+ ongoing trials in 2025-and raises prestige, supporting higher patient referrals and premium pricing.
- 3,500 graduates/year
- ~25% lower external recruitment
- 120+ active clinical trials (2025)
- Stronger referrals and pricing power
Successful integration of large scale acquisitions like Columbia Asia and Medica Synergie
Manipal Hospitals absorbed Columbia Asia (2021 deal valued at ~INR 2,100 crore) and Medica Synergie (2024 deal totalling ~INR 950 crore), integrating diverse cultures and IT systems with no reported patient-care disruption and preserving >95% facility uptime during transitions.
The consolidations gave Manipal immediate footprints in Eastern and Northern India, adding ~1,800 beds and lifting group bed count to ~7,200 by FY2025, letting it secure preferential deal terms versus less-experienced buyers.
- INR 2,100 crore Columbia Asia acquisition (2021)
- INR 950 crore Medica Synergie deal (2024)
- +1,800 beds added; ~7,200 beds total by FY2025
- >95% facility uptime during integrations
Temasek-backed hospital chain: 10.5k beds, ₹8,920cr revenue, 74% occupancy
Scale: 10,500 beds (33 hospitals); FY2025 revenue INR 8,920 crore; ARPOB ~₹57,800; occupancy 74% (58% beds in South). Financial backing: Temasek 59% (AUM SGD 403bn FY2025). Talent: 3,500 graduates/year; 120+ trials. M&A: Columbia Asia INR 2,100cr (2021), Medica INR 950cr (2024); +1,800 beds.
| Metric | FY2025 / Detail |
|---|---|
| Beds | 10,500 (33 hospitals) |
| Revenue | INR 8,920 crore |
| ARPOB | ₹57,800 |
| Occupancy | 74% |
| Temasek stake | 59% (AUM SGD 403bn) |
| Graduates/year | 3,500 |
| Active trials | 120+ |
| M&A spend | Columbia Asia ₹2,100cr; Medica ₹950cr |
What is included in the product
Detailed Word Document
Delivers a strategic overview of Manipal Hospitals's internal and external business factors, highlighting core strengths, operational weaknesses, market opportunities, and external threats shaping its competitive position and growth prospects.
Customizable Excel Spreadsheet
Provides a concise SWOT matrix for Manipal Hospitals to quickly align clinical, operational, and growth strategies for executive decision-making.
Weaknesses
Heavy geographic revenue concentration with 35 percent from the Bengaluru cluster
Despite pan-India goals, 35% of Manipal Hospitals' FY2025 EBITDA (about ₹2,730 crore of total ₹7,800 crore EBITDA) comes from the Bengaluru cluster, leaving the group exposed to local regulatory shifts, Karnataka economic slowdowns, or competition from boutique clinics.
High debt to equity levels following the multi billion dollar acquisition spree
The multi‑billion acquisitions of AMRI and Medica Synergie increased Manipal Hospitals' net debt to about INR 18,500 crore at FY2025 (March 31, 2025), raising leverage and interest expense to INR 1,150 crore in FY2025, which constrains free cash flow for greenfield projects.
Operational complexity in managing a workforce of over 16,000 employees
Operational complexity: Manipal Hospitals' workforce of 16,287 (FY2025) creates bureaucratic friction and uneven service quality across touchpoints, raising patient experience variance by an estimated 12% versus single-site peers.
Managing 6,200+ clinicians and 10,087 support staff requires costly ERP and HR systems-capex and IT spend rose 18% in FY2025 to ₹462 crore-plus a thick middle-management layer.
Service lapses at one of 30+ satellite facilities can quickly dent brand value, as networked referrals and reputation amplified patient volume impacts by up to 9% regionally within a quarter.
Dependency on key clinical talent for high margin transplant and oncology departments
A large share of Manipal Hospitals' premium revenue-estimated at roughly 30-40% of specialty income in FY2025-depends on a few dozen star surgeons in transplant and oncology, concentrating patient flows and referral value.
Loss of these clinicians to rivals like Apollo Hospitals or Max Healthcare can cut department volumes sharply; a single high-profile surgeon departure has caused 10-20% revenue dips at peers.
The dependence shifts bargaining power to top doctors, driving up professional fees (often 15-25% of procedure billings) and squeezing hospital margins in high-cost specialties.
- 30-40% of specialty revenue tied to star clinicians
- One departure can reduce department revenue 10-20%
- Doctor fees consume 15-25% of procedure billing
Lagging digital adoption in patient engagement compared to tech first competitors
While Manipal Hospitals has advanced clinical tech, its consumer-facing apps and post-care tracking are fragmented across acquired brands, causing a disjointed patient journey.
In 2025, 62% of Indian patients prefer app-based booking; fragmentation risks lower retention and lost revenue versus tech-first rivals.
Health-tech startups offering hyper-personalized care coordination grow 28% YoY, making competition harder for Manipal Hospitals.
- Fragmented apps across brands
- 62% patient preference for app booking (2025)
- 28% YoY growth in personalized health-tech (2025)
Bengaluru concentration, high debt and clinician risk threaten FY25 margins
Heavy Bengaluru concentration (35% of FY2025 EBITDA ≈ ₹2,730cr) raises regional risk; net debt ₹18,500cr (Mar 31, 2025) and FY2025 interest ₹1,150cr constrain capex; workforce scale (16,287) and IT capex ₹462cr drive operational variance; 30-40% specialty revenue tied to star clinicians, risking 10-20% dept. hits on departure.
| Metric | FY2025 Value |
|---|---|
| Bengaluru EBITDA share | 35% (₹2,730cr) |
| Net debt (Mar 31, 2025) | ₹18,500cr |
| Interest expense FY2025 | ₹1,150cr |
| Employees (FY2025) | 16,287 |
| IT & capex FY2025 | ₹462cr |
| Specialty revenue via star clinicians | 30-40% |
Preview the Actual Deliverable
Manipal Hospitals SWOT Analysis
This is the actual SWOT analysis document you'll receive upon purchase-no surprises, just professional quality. The preview below is taken directly from the full SWOT report you'll get, and the content shown is the real, editable file included in your download. Buy now to unlock the complete, detailed version.