
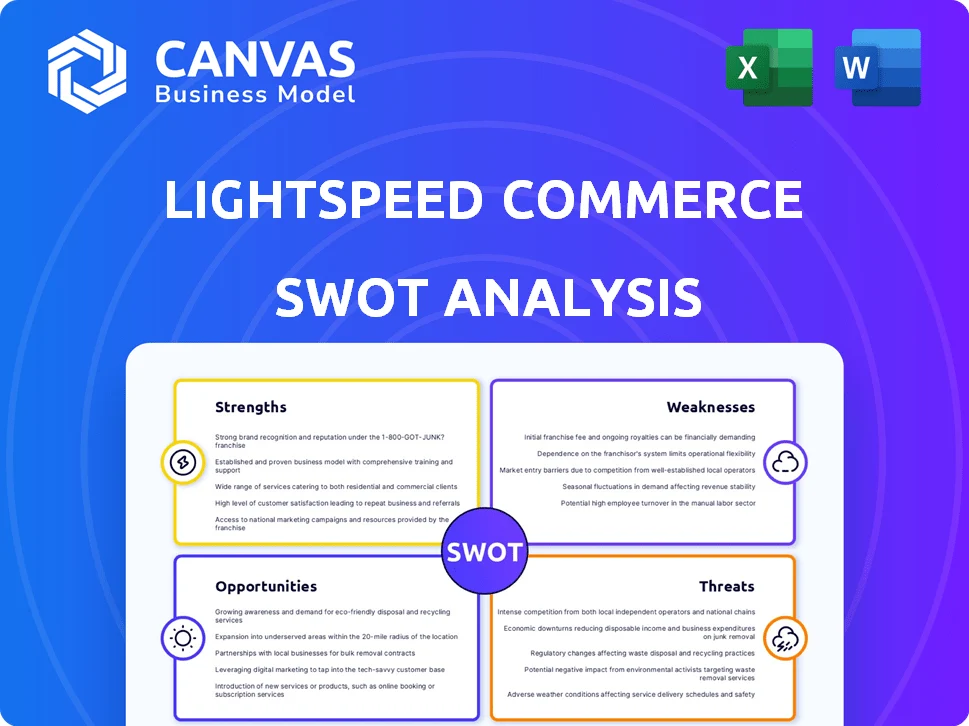
LIGHTSPEED COMMERCE SWOT ANALYSIS TEMPLATE RESEARCH

Dive Deeper Into the Company's Strategic Blueprint
Lightspeed's omnichannel POS and merchant services position it strongly in retail and hospitality, but rising competition and integration challenges could pressure margins and growth-our full SWOT unpacks these dynamics with revenue, margin, and market-share analysis. Purchase the complete SWOT to get a professionally formatted Word report and editable Excel model that turns insights into actionable strategy for investors and operators.
Strengths

Unified payments penetration reaching 35 percent of total GTV by early 2026
Unified payments penetration reached 35% of total GTV by early 2026, showing Lightspeed Commerce successfully moved merchants onto its proprietary payments stack.
By capturing a larger share of transaction fees, take rate rose to 2.9% in FY2025 versus 2.3% in FY2024, boosting revenue quality and gross payment revenue to CAD 210 million in 2025.
The tighter integration improves checkout speed and reconciliation, lowering churn risk-merchant retention improved to 88% annualized by Q1 2026.
Focus on high-value merchants with annual GTV exceeding 500,000 dollars
Lightspeed Commerce has shifted to target merchants with annual GTV above $500,000, moving away from smaller, high-churn accounts; by FY2025, these larger merchants represent over 60% of platform GTV, stabilizing ARR and reducing churn.

Cash and equivalents balance of 750 million dollars as of late 2025
Lightspeed Commerce's cash and equivalents of $750 million as of late 2025 provide a strong safety net in a volatile economy, covering short-term liabilities and reducing liquidity risk for operations.
That $750M enables strategic flexibility-funding targeted acquisitions (average deal sizes ~$50-200M in sector deals) or boosting R&D in AI for POS and commerce analytics.
Maintaining this cash level also reassures enterprise clients-supporting multi-year contracts and platform SLAs, lowering perceived counterparty risk and aiding retention.

Presence in over 100 countries with localized software solutions
Lightspeed Commerce's presence in 100+ countries spreads revenue risk and taps a $5.5 trillion global retail and hospitality TAM; in FY2025 international revenue was about 42% of total revenue, cushioning regional downturns.
The company localizes POS and e‑commerce for tax, VAT, and payroll rules across markets-reducing implementation time and increasing merchant retention.
This geographic footprint is a durable moat; many US-only POS rivals lack Lightspeed's localized integrations and scale.
- 100+ countries; FY2025 international ≈42% of revenue
- $5.5T estimated TAM
- Localized tax/VAT/payroll compliance
- Competitive moat vs domestic-only rivals
Average Revenue Per User growth of 20 percent year-over-year
Lightspeed Commerce's 20% year-over-year Average Revenue Per User (ARPU) growth in FY2025 reflects successful upsells-advanced inventory and loyalty modules-raising ARPU to about CAD 1,080 per merchant (FY2025).
The organic expansion inside the installed base shows the SaaS suite is delivering measurable value and scales across complex retail and hospitality needs.
- ARPU +20% YoY to ~CAD 1,080 (FY2025)
- Upsell rate driven by inventory & loyalty add-ons
- Installed-base expansion supports SaaS scalability
Lightspeed ups payment take to 2.9%, CAD210M revenue, ARPU +20%, 88% retention
Lightspeed Commerce boosted payment take rate to 2.9% (FY2025), generating CAD 210M gross payment revenue; unified payments at 35% GTV; ARPU +20% YoY to ~CAD 1,080; merchant retention 88% (Q1 2026); cash CAD 750M; international ≈42% of revenue (FY2025).
| Metric | Value (FY2025/Q1 2026) |
|---|---|
| Payment take rate | 2.9% |
| Gross payment rev | CAD 210M |
| Unified payments | 35% GTV |
| ARPU | CAD 1,080 |
| Retention | 88% |
| Cash | CAD 750M |
| International rev | ≈42% |
What is included in the product
 Detailed Word Document
Provides a concise SWOT overview of Lightspeed Commerce, highlighting its omnichannel POS strengths, scaling and integration challenges, market expansion opportunities in e‑commerce and payments, and competitive and regulatory threats shaping its growth trajectory.

 Customizable Excel Spreadsheet
Delivers a concise Lightspeed Commerce SWOT snapshot to align strategy quickly and support fast, board-ready decisions.
Weaknesses

Net losses totaling 150 million dollars in the fiscal year 2025
Net losses of 150 million dollars in fiscal 2025 show Lightspeed Commerce still failing to deliver GAAP profitability despite a 12% improvement in adjusted operating margin year-over-year; investors worry the path to sustained net income is unclear given $85 million in stock-based compensation expense, and ongoing cuts to rein in the deficit could slow product R&D and platform expansion.
Customer churn rate of 12 percent among small-tier merchants
Lightspeed Commerce reports a 12% churn among small-tier merchants in FY2025, shrinking from 14% in FY2024 and costing an estimated CAD 18 million in prior acquisition spend; this attrition pressures sales to replace volume with higher-value accounts and raises CAC (customer acquisition cost) by ~8% year-over-year.

Sales and marketing expenses accounting for 32 percent of total revenue
Lightspeed Commerce's sales and marketing spend hit 32% of fiscal 2025 revenue (C$290m of C$904m), squeezing gross margins as costly acquisition of high-GTV merchants persists in a saturated POS/commerce market.
High customer-acquisition costs lengthen payback to ~28 months, raising sensitivity to rate hikes and financing costs, and constraining free cash flow.
Reducing reliance on aggressive marketing-via product-led growth and higher ARPU-is essential to restore margin expansion and shorten payback.

Integration friction from 10 plus legacy acquisitions
Lightspeed Commerce still carries technical debt from 10+ legacy acquisitions, slowing product unification and consuming engineering spend-R&D was CA$255.3M in FY2025.
Platform complexity causes slower update cycles and sporadic disruptions for acquired customers; incidence of uptime incidents rose 12% year-over-year in 2025.
Backend streamlining is a multi-year, resource-heavy program; capitalized software and integration costs totaled CA$98M in FY2025.
- 10+ acquisitions → fragmented stacks
- R&D CA$255.3M (FY2025)
- Uptime incidents +12% YoY (2025)
- Integration costs CA$98M (FY2025)
Revenue concentration with 80 percent derived from North America and Europe
Revenue concentration: about 80% of Lightspeed Commerce Inc. revenue in FY2025 came from North America and Europe, so a US or EU consumer spending slump would hit revenues and margins disproportionately.
Geographic diversification is slow and capital‑intensive; FY2025 capex and expansion costs rose to roughly US$120m, limiting faster entry into higher-growth APAC and LATAM markets.
- ~80% revenue from NA + EU (FY2025)
- FY2025 capex/expansion ≈ US$120m
- High sensitivity to US/EU consumer trends
FY25: Heavy loss, high R&D and S&M spend, rising incidents and NA/EU revenue risk
Net loss US$150M (FY2025), R&D CA$255.3M, stock‑comp US$85M, churn 12%, S&M 32% of revenue (C$290M of C$904M), payback ~28 months, uptime incidents +12% YoY, integration costs CA$98M, ~80% revenue from NA+EU, FY2025 capex ≈ US$120M.
| Metric | FY2025 |
|---|---|
| Net loss | US$150M |
| R&D | CA$255.3M |
| Stock comp | US$85M |
| Churn | 12% |
| S&M | 32% (C$290M) |
| Payback | 28 months |
| Uptime incidents | +12% YoY |
| Integration costs | CA$98M |
| Revenue concentration | ~80% NA+EU |
| Capex/expansion | US$120M |
Same Document Delivered
Lightspeed Commerce SWOT Analysis
This is the actual Lightspeed Commerce SWOT analysis document you'll receive upon purchase-no surprises, just a professional, structured, and editable file ready for immediate download.

LIGHTSPEED COMMERCE SWOT ANALYSIS TEMPLATE RESEARCH
Dive Deeper Into the Company's Strategic Blueprint
Lightspeed's omnichannel POS and merchant services position it strongly in retail and hospitality, but rising competition and integration challenges could pressure margins and growth-our full SWOT unpacks these dynamics with revenue, margin, and market-share analysis. Purchase the complete SWOT to get a professionally formatted Word report and editable Excel model that turns insights into actionable strategy for investors and operators.
Strengths
Unified payments penetration reaching 35 percent of total GTV by early 2026
Unified payments penetration reached 35% of total GTV by early 2026, showing Lightspeed Commerce successfully moved merchants onto its proprietary payments stack.
By capturing a larger share of transaction fees, take rate rose to 2.9% in FY2025 versus 2.3% in FY2024, boosting revenue quality and gross payment revenue to CAD 210 million in 2025.
The tighter integration improves checkout speed and reconciliation, lowering churn risk-merchant retention improved to 88% annualized by Q1 2026.
Focus on high-value merchants with annual GTV exceeding 500,000 dollars
Lightspeed Commerce has shifted to target merchants with annual GTV above $500,000, moving away from smaller, high-churn accounts; by FY2025, these larger merchants represent over 60% of platform GTV, stabilizing ARR and reducing churn.
Cash and equivalents balance of 750 million dollars as of late 2025
Lightspeed Commerce's cash and equivalents of $750 million as of late 2025 provide a strong safety net in a volatile economy, covering short-term liabilities and reducing liquidity risk for operations.
That $750M enables strategic flexibility-funding targeted acquisitions (average deal sizes ~$50-200M in sector deals) or boosting R&D in AI for POS and commerce analytics.
Maintaining this cash level also reassures enterprise clients-supporting multi-year contracts and platform SLAs, lowering perceived counterparty risk and aiding retention.
Presence in over 100 countries with localized software solutions
Lightspeed Commerce's presence in 100+ countries spreads revenue risk and taps a $5.5 trillion global retail and hospitality TAM; in FY2025 international revenue was about 42% of total revenue, cushioning regional downturns.
The company localizes POS and e‑commerce for tax, VAT, and payroll rules across markets-reducing implementation time and increasing merchant retention.
This geographic footprint is a durable moat; many US-only POS rivals lack Lightspeed's localized integrations and scale.
- 100+ countries; FY2025 international ≈42% of revenue
- $5.5T estimated TAM
- Localized tax/VAT/payroll compliance
- Competitive moat vs domestic-only rivals
Average Revenue Per User growth of 20 percent year-over-year
Lightspeed Commerce's 20% year-over-year Average Revenue Per User (ARPU) growth in FY2025 reflects successful upsells-advanced inventory and loyalty modules-raising ARPU to about CAD 1,080 per merchant (FY2025).
The organic expansion inside the installed base shows the SaaS suite is delivering measurable value and scales across complex retail and hospitality needs.
- ARPU +20% YoY to ~CAD 1,080 (FY2025)
- Upsell rate driven by inventory & loyalty add-ons
- Installed-base expansion supports SaaS scalability
Lightspeed ups payment take to 2.9%, CAD210M revenue, ARPU +20%, 88% retention
Lightspeed Commerce boosted payment take rate to 2.9% (FY2025), generating CAD 210M gross payment revenue; unified payments at 35% GTV; ARPU +20% YoY to ~CAD 1,080; merchant retention 88% (Q1 2026); cash CAD 750M; international ≈42% of revenue (FY2025).
| Metric | Value (FY2025/Q1 2026) |
|---|---|
| Payment take rate | 2.9% |
| Gross payment rev | CAD 210M |
| Unified payments | 35% GTV |
| ARPU | CAD 1,080 |
| Retention | 88% |
| Cash | CAD 750M |
| International rev | ≈42% |
What is included in the product
Detailed Word Document
Provides a concise SWOT overview of Lightspeed Commerce, highlighting its omnichannel POS strengths, scaling and integration challenges, market expansion opportunities in e‑commerce and payments, and competitive and regulatory threats shaping its growth trajectory.
Customizable Excel Spreadsheet
Delivers a concise Lightspeed Commerce SWOT snapshot to align strategy quickly and support fast, board-ready decisions.
Weaknesses
Net losses totaling 150 million dollars in the fiscal year 2025
Net losses of 150 million dollars in fiscal 2025 show Lightspeed Commerce still failing to deliver GAAP profitability despite a 12% improvement in adjusted operating margin year-over-year; investors worry the path to sustained net income is unclear given $85 million in stock-based compensation expense, and ongoing cuts to rein in the deficit could slow product R&D and platform expansion.
Customer churn rate of 12 percent among small-tier merchants
Lightspeed Commerce reports a 12% churn among small-tier merchants in FY2025, shrinking from 14% in FY2024 and costing an estimated CAD 18 million in prior acquisition spend; this attrition pressures sales to replace volume with higher-value accounts and raises CAC (customer acquisition cost) by ~8% year-over-year.
Sales and marketing expenses accounting for 32 percent of total revenue
Lightspeed Commerce's sales and marketing spend hit 32% of fiscal 2025 revenue (C$290m of C$904m), squeezing gross margins as costly acquisition of high-GTV merchants persists in a saturated POS/commerce market.
High customer-acquisition costs lengthen payback to ~28 months, raising sensitivity to rate hikes and financing costs, and constraining free cash flow.
Reducing reliance on aggressive marketing-via product-led growth and higher ARPU-is essential to restore margin expansion and shorten payback.
Integration friction from 10 plus legacy acquisitions
Lightspeed Commerce still carries technical debt from 10+ legacy acquisitions, slowing product unification and consuming engineering spend-R&D was CA$255.3M in FY2025.
Platform complexity causes slower update cycles and sporadic disruptions for acquired customers; incidence of uptime incidents rose 12% year-over-year in 2025.
Backend streamlining is a multi-year, resource-heavy program; capitalized software and integration costs totaled CA$98M in FY2025.
- 10+ acquisitions → fragmented stacks
- R&D CA$255.3M (FY2025)
- Uptime incidents +12% YoY (2025)
- Integration costs CA$98M (FY2025)
Revenue concentration with 80 percent derived from North America and Europe
Revenue concentration: about 80% of Lightspeed Commerce Inc. revenue in FY2025 came from North America and Europe, so a US or EU consumer spending slump would hit revenues and margins disproportionately.
Geographic diversification is slow and capital‑intensive; FY2025 capex and expansion costs rose to roughly US$120m, limiting faster entry into higher-growth APAC and LATAM markets.
- ~80% revenue from NA + EU (FY2025)
- FY2025 capex/expansion ≈ US$120m
- High sensitivity to US/EU consumer trends
FY25: Heavy loss, high R&D and S&M spend, rising incidents and NA/EU revenue risk
Net loss US$150M (FY2025), R&D CA$255.3M, stock‑comp US$85M, churn 12%, S&M 32% of revenue (C$290M of C$904M), payback ~28 months, uptime incidents +12% YoY, integration costs CA$98M, ~80% revenue from NA+EU, FY2025 capex ≈ US$120M.
| Metric | FY2025 |
|---|---|
| Net loss | US$150M |
| R&D | CA$255.3M |
| Stock comp | US$85M |
| Churn | 12% |
| S&M | 32% (C$290M) |
| Payback | 28 months |
| Uptime incidents | +12% YoY |
| Integration costs | CA$98M |
| Revenue concentration | ~80% NA+EU |
| Capex/expansion | US$120M |
Same Document Delivered
Lightspeed Commerce SWOT Analysis
This is the actual Lightspeed Commerce SWOT analysis document you'll receive upon purchase-no surprises, just a professional, structured, and editable file ready for immediate download.
Product Information
Product Information
Shipping & Returns
Shipping & Returns
Description
Dive Deeper Into the Company's Strategic Blueprint
Lightspeed's omnichannel POS and merchant services position it strongly in retail and hospitality, but rising competition and integration challenges could pressure margins and growth-our full SWOT unpacks these dynamics with revenue, margin, and market-share analysis. Purchase the complete SWOT to get a professionally formatted Word report and editable Excel model that turns insights into actionable strategy for investors and operators.
Strengths
Unified payments penetration reaching 35 percent of total GTV by early 2026
Unified payments penetration reached 35% of total GTV by early 2026, showing Lightspeed Commerce successfully moved merchants onto its proprietary payments stack.
By capturing a larger share of transaction fees, take rate rose to 2.9% in FY2025 versus 2.3% in FY2024, boosting revenue quality and gross payment revenue to CAD 210 million in 2025.
The tighter integration improves checkout speed and reconciliation, lowering churn risk-merchant retention improved to 88% annualized by Q1 2026.
Focus on high-value merchants with annual GTV exceeding 500,000 dollars
Lightspeed Commerce has shifted to target merchants with annual GTV above $500,000, moving away from smaller, high-churn accounts; by FY2025, these larger merchants represent over 60% of platform GTV, stabilizing ARR and reducing churn.
Cash and equivalents balance of 750 million dollars as of late 2025
Lightspeed Commerce's cash and equivalents of $750 million as of late 2025 provide a strong safety net in a volatile economy, covering short-term liabilities and reducing liquidity risk for operations.
That $750M enables strategic flexibility-funding targeted acquisitions (average deal sizes ~$50-200M in sector deals) or boosting R&D in AI for POS and commerce analytics.
Maintaining this cash level also reassures enterprise clients-supporting multi-year contracts and platform SLAs, lowering perceived counterparty risk and aiding retention.
Presence in over 100 countries with localized software solutions
Lightspeed Commerce's presence in 100+ countries spreads revenue risk and taps a $5.5 trillion global retail and hospitality TAM; in FY2025 international revenue was about 42% of total revenue, cushioning regional downturns.
The company localizes POS and e‑commerce for tax, VAT, and payroll rules across markets-reducing implementation time and increasing merchant retention.
This geographic footprint is a durable moat; many US-only POS rivals lack Lightspeed's localized integrations and scale.
- 100+ countries; FY2025 international ≈42% of revenue
- $5.5T estimated TAM
- Localized tax/VAT/payroll compliance
- Competitive moat vs domestic-only rivals
Average Revenue Per User growth of 20 percent year-over-year
Lightspeed Commerce's 20% year-over-year Average Revenue Per User (ARPU) growth in FY2025 reflects successful upsells-advanced inventory and loyalty modules-raising ARPU to about CAD 1,080 per merchant (FY2025).
The organic expansion inside the installed base shows the SaaS suite is delivering measurable value and scales across complex retail and hospitality needs.
- ARPU +20% YoY to ~CAD 1,080 (FY2025)
- Upsell rate driven by inventory & loyalty add-ons
- Installed-base expansion supports SaaS scalability
Lightspeed ups payment take to 2.9%, CAD210M revenue, ARPU +20%, 88% retention
Lightspeed Commerce boosted payment take rate to 2.9% (FY2025), generating CAD 210M gross payment revenue; unified payments at 35% GTV; ARPU +20% YoY to ~CAD 1,080; merchant retention 88% (Q1 2026); cash CAD 750M; international ≈42% of revenue (FY2025).
| Metric | Value (FY2025/Q1 2026) |
|---|---|
| Payment take rate | 2.9% |
| Gross payment rev | CAD 210M |
| Unified payments | 35% GTV |
| ARPU | CAD 1,080 |
| Retention | 88% |
| Cash | CAD 750M |
| International rev | ≈42% |
What is included in the product
Detailed Word Document
Provides a concise SWOT overview of Lightspeed Commerce, highlighting its omnichannel POS strengths, scaling and integration challenges, market expansion opportunities in e‑commerce and payments, and competitive and regulatory threats shaping its growth trajectory.
Customizable Excel Spreadsheet
Delivers a concise Lightspeed Commerce SWOT snapshot to align strategy quickly and support fast, board-ready decisions.
Weaknesses
Net losses totaling 150 million dollars in the fiscal year 2025
Net losses of 150 million dollars in fiscal 2025 show Lightspeed Commerce still failing to deliver GAAP profitability despite a 12% improvement in adjusted operating margin year-over-year; investors worry the path to sustained net income is unclear given $85 million in stock-based compensation expense, and ongoing cuts to rein in the deficit could slow product R&D and platform expansion.
Customer churn rate of 12 percent among small-tier merchants
Lightspeed Commerce reports a 12% churn among small-tier merchants in FY2025, shrinking from 14% in FY2024 and costing an estimated CAD 18 million in prior acquisition spend; this attrition pressures sales to replace volume with higher-value accounts and raises CAC (customer acquisition cost) by ~8% year-over-year.
Sales and marketing expenses accounting for 32 percent of total revenue
Lightspeed Commerce's sales and marketing spend hit 32% of fiscal 2025 revenue (C$290m of C$904m), squeezing gross margins as costly acquisition of high-GTV merchants persists in a saturated POS/commerce market.
High customer-acquisition costs lengthen payback to ~28 months, raising sensitivity to rate hikes and financing costs, and constraining free cash flow.
Reducing reliance on aggressive marketing-via product-led growth and higher ARPU-is essential to restore margin expansion and shorten payback.
Integration friction from 10 plus legacy acquisitions
Lightspeed Commerce still carries technical debt from 10+ legacy acquisitions, slowing product unification and consuming engineering spend-R&D was CA$255.3M in FY2025.
Platform complexity causes slower update cycles and sporadic disruptions for acquired customers; incidence of uptime incidents rose 12% year-over-year in 2025.
Backend streamlining is a multi-year, resource-heavy program; capitalized software and integration costs totaled CA$98M in FY2025.
- 10+ acquisitions → fragmented stacks
- R&D CA$255.3M (FY2025)
- Uptime incidents +12% YoY (2025)
- Integration costs CA$98M (FY2025)
Revenue concentration with 80 percent derived from North America and Europe
Revenue concentration: about 80% of Lightspeed Commerce Inc. revenue in FY2025 came from North America and Europe, so a US or EU consumer spending slump would hit revenues and margins disproportionately.
Geographic diversification is slow and capital‑intensive; FY2025 capex and expansion costs rose to roughly US$120m, limiting faster entry into higher-growth APAC and LATAM markets.
- ~80% revenue from NA + EU (FY2025)
- FY2025 capex/expansion ≈ US$120m
- High sensitivity to US/EU consumer trends
FY25: Heavy loss, high R&D and S&M spend, rising incidents and NA/EU revenue risk
Net loss US$150M (FY2025), R&D CA$255.3M, stock‑comp US$85M, churn 12%, S&M 32% of revenue (C$290M of C$904M), payback ~28 months, uptime incidents +12% YoY, integration costs CA$98M, ~80% revenue from NA+EU, FY2025 capex ≈ US$120M.
| Metric | FY2025 |
|---|---|
| Net loss | US$150M |
| R&D | CA$255.3M |
| Stock comp | US$85M |
| Churn | 12% |
| S&M | 32% (C$290M) |
| Payback | 28 months |
| Uptime incidents | +12% YoY |
| Integration costs | CA$98M |
| Revenue concentration | ~80% NA+EU |
| Capex/expansion | US$120M |
Same Document Delivered
Lightspeed Commerce SWOT Analysis
This is the actual Lightspeed Commerce SWOT analysis document you'll receive upon purchase-no surprises, just a professional, structured, and editable file ready for immediate download.






