
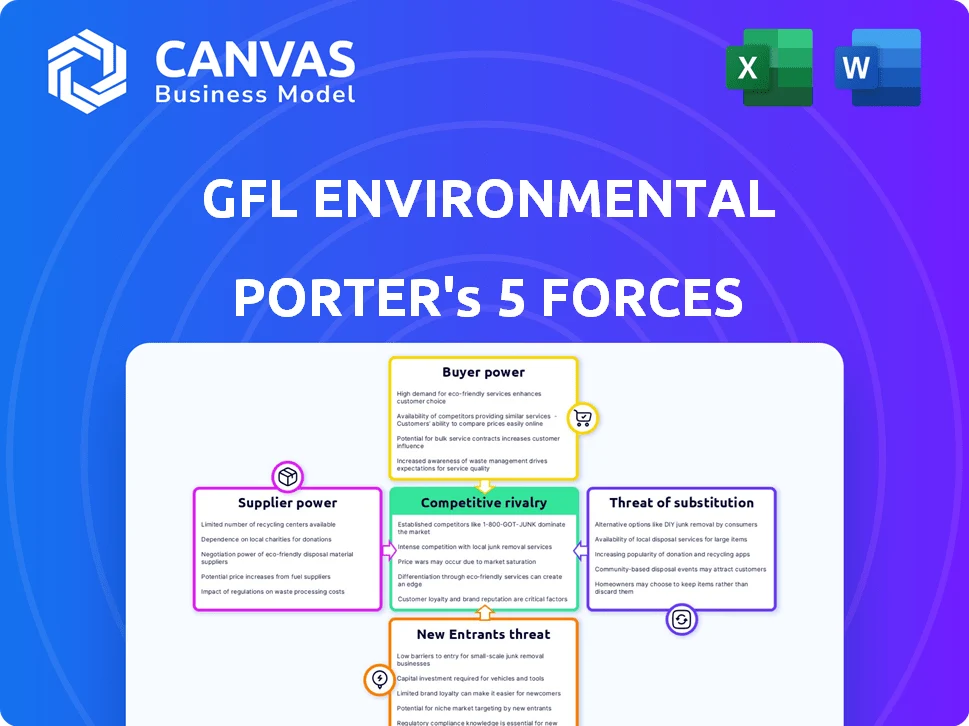
GFL ENVIRONMENTAL PORTER'S FIVE FORCES TEMPLATE RESEARCH

Don't Miss the Bigger Picture
GFL Environmental faces moderate supplier power, high customer concentration in some segments, and persistent regulatory and operational barriers that shape competitive intensity and margin pressure.
This brief snapshot only scratches the surface. Unlock the full Porter's Five Forces Analysis to explore GFL Environmental's competitive dynamics, market pressures, and strategic advantages in detail.
Suppliers Bargaining Power

Specialized Equipment Manufacturers
GFL Environmental depends on a small set of OEMs (Mack, Peterbilt) for specialized fleets; in FY2025 GFL's hauling capex reached about US$1.1bn, keeping fleet replacement tied to these suppliers.
These OEMs hold leverage since custom waste configurations limit swaps to generic trucks; <2025> retrofit costs averaged US$75-120k per vehicle, raising switching barriers.
By 2026 the shift to electric/CNG concentrated power: OEMs control proprietary battery/motor systems and 60-70% of certified green waste-truck platforms, increasing supplier bargaining power.
Volatile Energy and Fuel Costs
Fuel is one of GFL Environmental's largest variable costs, accounting for roughly 8-10% of operating expense in FY2025, and the company is a price-taker in tight global energy markets.
Fuel surcharges recoup some cost, but sudden diesel spikes-diesel averaged $4.10/gal in 2025 versus $3.25/gal in 2023-can compress margins until passed to customers.
Ongoing 2025-early-2026 geopolitical tensions kept natural gas and diesel spreads elevated, giving energy suppliers short-term bargaining power over GFL's input costs.

Skilled Labor and Driver Shortages
The shortage of qualified commercial drivers and heavy-equipment mechanics is a sector-wide bottleneck; GFL Environmental reported wage inflation raising driver pay ~8-12% in 2025, pushing labor cost as a major margin pressure.
Unionized jurisdictions amplify workforce bargaining power-GFL faces higher negotiated wages and benefits in provinces/states where unions cover ~30-40% of frontline staff.
GFL must trade rising labor expenses-which grew ~6% YoY in 2025 operating costs-against efficiency gains from route optimization and fleet utilization, making human capital a key cost lever.

Landfill and Disposal Site Access
Where GFL Environmental lacks ownership of primary landfills, third-party operators set tipping fees; in 2025 GFL paid average Ontario landfill tipping fees of C$125-C$155/tonne, exposing them to hikes and margin pressure.
Regulatory barriers delay new sites-typical permitting takes 5-10 years-so GFL often hauls to secondary sites, adding ~$8-$20/tonne in transport costs and reducing EBITDA per tonne.
- Third-party fee exposure: C$125-C$155/tonne (2025 Ontario)
- Permitting delay: 5-10 years (typical)
- Additional haul cost: ~$8-$20/tonne
- Result: compressed margins, higher logistics spend
Environmental Compliance and Tech Providers
As ESG reporting and mandatory carbon tracking take effect in 2026, GFL Environmental relies heavily on specialized software and sensor providers for emissions data and audit trails; vendor contracts now represent an estimated 3-5% of GFL's annual IT and compliance spend (~USD 15-25M in 2025 capex/opex related to data systems).
These tech firms supply the data architecture GFL needs to validate sustainability metrics to regulators and investors, and integrated platform switching costs-often 12-18 months of migration plus 10-20% of annual platform value-give vendors sustained leverage.
Given long-term contracts and proprietary data formats, supplier bargaining power is high, raising risks to margins and disclosure timelines if prices or service levels shift.
- Mandatory 2026 ESG rules raise dependence on tech vendors
- GFL 2025 estimated spend on data systems: USD 15-25M
- Switching costs: 12-18 months, 10-20% platform value
- High supplier leverage can pressure margins and timelines
Suppliers Dominate: 60-70% Platform Control, $1.1B Hauling Capex & High Retrofit Costs
Suppliers hold high bargaining power: OEMs (Mack/Peterbilt) + EV/CNG vendors control 60-70% green platforms; hauling capex US$1.1bn (FY2025); retrofit US$75-120k/vehicle; fuel 8-10% of OPEX (diesel US$4.10/gal 2025); tipping fees C$125-155/tonne; data vendors 3-5% spend (~US$15-25M 2025), high switching costs.
| Metric | 2025 Value |
|---|---|
| Hauling capex | US$1.1bn |
| Retrofit/vehicle | US$75-120k |
| Fuel % OPEX | 8-10% |
| Diesel price | US$4.10/gal |
| Tipping fees (ON) | C$125-155/tonne |
| Data spend | US$15-25M |
What is included in the product
 Detailed Word Document
Tailored Porter's Five Forces for GFL Environmental that uncovers competitive intensity, buyer/supplier leverage, threat of substitutes and new entrants, and highlights disruptive risks and strategic levers influencing pricing and profitability.

 Customizable Excel Spreadsheet
A concise Porter's Five Forces snapshot for GFL Environmental-clarifies competitive pressure points and regulatory risks for quick strategic decisions.
Customers Bargaining Power

Municipal Contract Bidding Processes
A large share of GFL Environmental revenue-about CA$5.8 billion in 2025-comes from long-term municipal contracts awarded via competitive RFPs, letting cities force price competition among majors and press margins down.
Commercial Sector Consolidation
GFL Environmental serves large national retail and industrial chains that have consolidated buying power; by FY2025 these top 50 customers accounted for roughly 22% of revenue, enabling demands for volume discounts and uniform service across geographies.
Such customers can shift portfolios if terms fail, so GFL often accepts thinner EBITDA margins-GFL's adjusted EBITDA margin fell to about 17.8% in FY2025 as high-volume pricing pressure rose.

Low Switching Costs for Small Businesses
For small commercial customers like restaurants and offices, switching costs are low-Industry Canada estimates 40-55% of SMBs switch providers for a 10% price gap, so price sensitivity is high.
This allows regional players or national firms to win clients with sign-up promos; GFL Environmental reported 2025 commercial revenue of CAD 2.8B, so churn hits top line.
Fragmentation in local markets (estimated 60% of accounts under 500 customers per provider) forces GFL to sustain service levels and keep local pricing competitive to prevent margin-eroding churn.

Increasing Sustainability Demands
Modern customers demand more than pickup; 62% of North American corporate supply-chain leaders (2024 PwC) require detailed waste-diversion reporting, pushing GFL Environmental to upgrade analytics and recycling services.
Large clients now often insist GFL invest in green tech-electrification, anaerobic digestion-before contracts; this shifts pricing and service design power to buyers.
As customers dictate service evolution, GFL's 2025 capital allocation (planned ~$500M in growth capex) must prioritize sustainability to retain big accounts.
- 62% of corporate buyers require diversion reporting
- GFL planned ~USD 500M growth capex in 2025
- Buyers push investment in electrification and recycling tech
Economic Sensitivity of Industrial Clients
GFL Environmental's infrastructure and liquid-waste segments serve heavy industry, so volumes fall with GDP; in 2025 industrial service revenue fell 6% YoY to about CAD 1.15bn as manufacturing output slowed, giving buyers leverage to cut pickup frequency and demand contract flexibility.
During downturns customers renegotiate rates and move to volume-flex contracts; GFL reported a 120 bps margin compression in H1 2025 tied to lower industrial volumes and increased discounting, underscoring buyer bargaining power.
- Industrial revenue ~CAD 1.15bn (2025)
- YoY decline 6% (2025)
- Margin compression ~120 bps H1 2025
- Buyers push volume-flex pricing in downturns
GFL margins squeezed by municipal leverage, industrial decline, CAD500M capex
Buyers hold strong leverage: municipal contracts (~CA$5.8B revenue, 2025) and top 50 customers (22% of revenue) force price competition and service demands, pushing GFL's adjusted EBITDA margin to ~17.8% in FY2025; industrial revenue fell to ~CAD1.15B (-6% YoY) causing ~120 bps H1 2025 margin compression; GFL planned ~CAD500M growth capex in 2025 to meet sustainability mandates.
| Metric | 2025 |
|---|---|
| Municipal-related revenue | CA$5.8B |
| Top 50 customers % | 22% |
| Adj. EBITDA margin | 17.8% |
| Industrial revenue | CAD1.15B (-6%) |
| H1 2025 margin impact | -120 bps |
| Planned growth capex | ~CAD500M |
Preview the Actual Deliverable
GFL Environmental Porter's Five Forces Analysis
This preview shows the exact Porter's Five Forces analysis of GFL Environmental you'll receive-no placeholders or samples; the full, professionally formatted document is available for immediate download upon purchase.

GFL ENVIRONMENTAL PORTER'S FIVE FORCES TEMPLATE RESEARCH
Don't Miss the Bigger Picture
GFL Environmental faces moderate supplier power, high customer concentration in some segments, and persistent regulatory and operational barriers that shape competitive intensity and margin pressure.
This brief snapshot only scratches the surface. Unlock the full Porter's Five Forces Analysis to explore GFL Environmental's competitive dynamics, market pressures, and strategic advantages in detail.
Suppliers Bargaining Power
Specialized Equipment Manufacturers
GFL Environmental depends on a small set of OEMs (Mack, Peterbilt) for specialized fleets; in FY2025 GFL's hauling capex reached about US$1.1bn, keeping fleet replacement tied to these suppliers.
These OEMs hold leverage since custom waste configurations limit swaps to generic trucks; <2025> retrofit costs averaged US$75-120k per vehicle, raising switching barriers.
By 2026 the shift to electric/CNG concentrated power: OEMs control proprietary battery/motor systems and 60-70% of certified green waste-truck platforms, increasing supplier bargaining power.
Volatile Energy and Fuel Costs
Fuel is one of GFL Environmental's largest variable costs, accounting for roughly 8-10% of operating expense in FY2025, and the company is a price-taker in tight global energy markets.
Fuel surcharges recoup some cost, but sudden diesel spikes-diesel averaged $4.10/gal in 2025 versus $3.25/gal in 2023-can compress margins until passed to customers.
Ongoing 2025-early-2026 geopolitical tensions kept natural gas and diesel spreads elevated, giving energy suppliers short-term bargaining power over GFL's input costs.
Skilled Labor and Driver Shortages
The shortage of qualified commercial drivers and heavy-equipment mechanics is a sector-wide bottleneck; GFL Environmental reported wage inflation raising driver pay ~8-12% in 2025, pushing labor cost as a major margin pressure.
Unionized jurisdictions amplify workforce bargaining power-GFL faces higher negotiated wages and benefits in provinces/states where unions cover ~30-40% of frontline staff.
GFL must trade rising labor expenses-which grew ~6% YoY in 2025 operating costs-against efficiency gains from route optimization and fleet utilization, making human capital a key cost lever.
Landfill and Disposal Site Access
Where GFL Environmental lacks ownership of primary landfills, third-party operators set tipping fees; in 2025 GFL paid average Ontario landfill tipping fees of C$125-C$155/tonne, exposing them to hikes and margin pressure.
Regulatory barriers delay new sites-typical permitting takes 5-10 years-so GFL often hauls to secondary sites, adding ~$8-$20/tonne in transport costs and reducing EBITDA per tonne.
- Third-party fee exposure: C$125-C$155/tonne (2025 Ontario)
- Permitting delay: 5-10 years (typical)
- Additional haul cost: ~$8-$20/tonne
- Result: compressed margins, higher logistics spend
Environmental Compliance and Tech Providers
As ESG reporting and mandatory carbon tracking take effect in 2026, GFL Environmental relies heavily on specialized software and sensor providers for emissions data and audit trails; vendor contracts now represent an estimated 3-5% of GFL's annual IT and compliance spend (~USD 15-25M in 2025 capex/opex related to data systems).
These tech firms supply the data architecture GFL needs to validate sustainability metrics to regulators and investors, and integrated platform switching costs-often 12-18 months of migration plus 10-20% of annual platform value-give vendors sustained leverage.
Given long-term contracts and proprietary data formats, supplier bargaining power is high, raising risks to margins and disclosure timelines if prices or service levels shift.
- Mandatory 2026 ESG rules raise dependence on tech vendors
- GFL 2025 estimated spend on data systems: USD 15-25M
- Switching costs: 12-18 months, 10-20% platform value
- High supplier leverage can pressure margins and timelines
Suppliers Dominate: 60-70% Platform Control, $1.1B Hauling Capex & High Retrofit Costs
Suppliers hold high bargaining power: OEMs (Mack/Peterbilt) + EV/CNG vendors control 60-70% green platforms; hauling capex US$1.1bn (FY2025); retrofit US$75-120k/vehicle; fuel 8-10% of OPEX (diesel US$4.10/gal 2025); tipping fees C$125-155/tonne; data vendors 3-5% spend (~US$15-25M 2025), high switching costs.
| Metric | 2025 Value |
|---|---|
| Hauling capex | US$1.1bn |
| Retrofit/vehicle | US$75-120k |
| Fuel % OPEX | 8-10% |
| Diesel price | US$4.10/gal |
| Tipping fees (ON) | C$125-155/tonne |
| Data spend | US$15-25M |
What is included in the product
Detailed Word Document
Tailored Porter's Five Forces for GFL Environmental that uncovers competitive intensity, buyer/supplier leverage, threat of substitutes and new entrants, and highlights disruptive risks and strategic levers influencing pricing and profitability.
Customizable Excel Spreadsheet
A concise Porter's Five Forces snapshot for GFL Environmental-clarifies competitive pressure points and regulatory risks for quick strategic decisions.
Customers Bargaining Power
Municipal Contract Bidding Processes
A large share of GFL Environmental revenue-about CA$5.8 billion in 2025-comes from long-term municipal contracts awarded via competitive RFPs, letting cities force price competition among majors and press margins down.
Commercial Sector Consolidation
GFL Environmental serves large national retail and industrial chains that have consolidated buying power; by FY2025 these top 50 customers accounted for roughly 22% of revenue, enabling demands for volume discounts and uniform service across geographies.
Such customers can shift portfolios if terms fail, so GFL often accepts thinner EBITDA margins-GFL's adjusted EBITDA margin fell to about 17.8% in FY2025 as high-volume pricing pressure rose.
Low Switching Costs for Small Businesses
For small commercial customers like restaurants and offices, switching costs are low-Industry Canada estimates 40-55% of SMBs switch providers for a 10% price gap, so price sensitivity is high.
This allows regional players or national firms to win clients with sign-up promos; GFL Environmental reported 2025 commercial revenue of CAD 2.8B, so churn hits top line.
Fragmentation in local markets (estimated 60% of accounts under 500 customers per provider) forces GFL to sustain service levels and keep local pricing competitive to prevent margin-eroding churn.
Increasing Sustainability Demands
Modern customers demand more than pickup; 62% of North American corporate supply-chain leaders (2024 PwC) require detailed waste-diversion reporting, pushing GFL Environmental to upgrade analytics and recycling services.
Large clients now often insist GFL invest in green tech-electrification, anaerobic digestion-before contracts; this shifts pricing and service design power to buyers.
As customers dictate service evolution, GFL's 2025 capital allocation (planned ~$500M in growth capex) must prioritize sustainability to retain big accounts.
- 62% of corporate buyers require diversion reporting
- GFL planned ~USD 500M growth capex in 2025
- Buyers push investment in electrification and recycling tech
Economic Sensitivity of Industrial Clients
GFL Environmental's infrastructure and liquid-waste segments serve heavy industry, so volumes fall with GDP; in 2025 industrial service revenue fell 6% YoY to about CAD 1.15bn as manufacturing output slowed, giving buyers leverage to cut pickup frequency and demand contract flexibility.
During downturns customers renegotiate rates and move to volume-flex contracts; GFL reported a 120 bps margin compression in H1 2025 tied to lower industrial volumes and increased discounting, underscoring buyer bargaining power.
- Industrial revenue ~CAD 1.15bn (2025)
- YoY decline 6% (2025)
- Margin compression ~120 bps H1 2025
- Buyers push volume-flex pricing in downturns
GFL margins squeezed by municipal leverage, industrial decline, CAD500M capex
Buyers hold strong leverage: municipal contracts (~CA$5.8B revenue, 2025) and top 50 customers (22% of revenue) force price competition and service demands, pushing GFL's adjusted EBITDA margin to ~17.8% in FY2025; industrial revenue fell to ~CAD1.15B (-6% YoY) causing ~120 bps H1 2025 margin compression; GFL planned ~CAD500M growth capex in 2025 to meet sustainability mandates.
| Metric | 2025 |
|---|---|
| Municipal-related revenue | CA$5.8B |
| Top 50 customers % | 22% |
| Adj. EBITDA margin | 17.8% |
| Industrial revenue | CAD1.15B (-6%) |
| H1 2025 margin impact | -120 bps |
| Planned growth capex | ~CAD500M |
Preview the Actual Deliverable
GFL Environmental Porter's Five Forces Analysis
This preview shows the exact Porter's Five Forces analysis of GFL Environmental you'll receive-no placeholders or samples; the full, professionally formatted document is available for immediate download upon purchase.
Product Information
Product Information
Shipping & Returns
Shipping & Returns
Description
Don't Miss the Bigger Picture
GFL Environmental faces moderate supplier power, high customer concentration in some segments, and persistent regulatory and operational barriers that shape competitive intensity and margin pressure.
This brief snapshot only scratches the surface. Unlock the full Porter's Five Forces Analysis to explore GFL Environmental's competitive dynamics, market pressures, and strategic advantages in detail.
Suppliers Bargaining Power
Specialized Equipment Manufacturers
GFL Environmental depends on a small set of OEMs (Mack, Peterbilt) for specialized fleets; in FY2025 GFL's hauling capex reached about US$1.1bn, keeping fleet replacement tied to these suppliers.
These OEMs hold leverage since custom waste configurations limit swaps to generic trucks; <2025> retrofit costs averaged US$75-120k per vehicle, raising switching barriers.
By 2026 the shift to electric/CNG concentrated power: OEMs control proprietary battery/motor systems and 60-70% of certified green waste-truck platforms, increasing supplier bargaining power.
Volatile Energy and Fuel Costs
Fuel is one of GFL Environmental's largest variable costs, accounting for roughly 8-10% of operating expense in FY2025, and the company is a price-taker in tight global energy markets.
Fuel surcharges recoup some cost, but sudden diesel spikes-diesel averaged $4.10/gal in 2025 versus $3.25/gal in 2023-can compress margins until passed to customers.
Ongoing 2025-early-2026 geopolitical tensions kept natural gas and diesel spreads elevated, giving energy suppliers short-term bargaining power over GFL's input costs.
Skilled Labor and Driver Shortages
The shortage of qualified commercial drivers and heavy-equipment mechanics is a sector-wide bottleneck; GFL Environmental reported wage inflation raising driver pay ~8-12% in 2025, pushing labor cost as a major margin pressure.
Unionized jurisdictions amplify workforce bargaining power-GFL faces higher negotiated wages and benefits in provinces/states where unions cover ~30-40% of frontline staff.
GFL must trade rising labor expenses-which grew ~6% YoY in 2025 operating costs-against efficiency gains from route optimization and fleet utilization, making human capital a key cost lever.
Landfill and Disposal Site Access
Where GFL Environmental lacks ownership of primary landfills, third-party operators set tipping fees; in 2025 GFL paid average Ontario landfill tipping fees of C$125-C$155/tonne, exposing them to hikes and margin pressure.
Regulatory barriers delay new sites-typical permitting takes 5-10 years-so GFL often hauls to secondary sites, adding ~$8-$20/tonne in transport costs and reducing EBITDA per tonne.
- Third-party fee exposure: C$125-C$155/tonne (2025 Ontario)
- Permitting delay: 5-10 years (typical)
- Additional haul cost: ~$8-$20/tonne
- Result: compressed margins, higher logistics spend
Environmental Compliance and Tech Providers
As ESG reporting and mandatory carbon tracking take effect in 2026, GFL Environmental relies heavily on specialized software and sensor providers for emissions data and audit trails; vendor contracts now represent an estimated 3-5% of GFL's annual IT and compliance spend (~USD 15-25M in 2025 capex/opex related to data systems).
These tech firms supply the data architecture GFL needs to validate sustainability metrics to regulators and investors, and integrated platform switching costs-often 12-18 months of migration plus 10-20% of annual platform value-give vendors sustained leverage.
Given long-term contracts and proprietary data formats, supplier bargaining power is high, raising risks to margins and disclosure timelines if prices or service levels shift.
- Mandatory 2026 ESG rules raise dependence on tech vendors
- GFL 2025 estimated spend on data systems: USD 15-25M
- Switching costs: 12-18 months, 10-20% platform value
- High supplier leverage can pressure margins and timelines
Suppliers Dominate: 60-70% Platform Control, $1.1B Hauling Capex & High Retrofit Costs
Suppliers hold high bargaining power: OEMs (Mack/Peterbilt) + EV/CNG vendors control 60-70% green platforms; hauling capex US$1.1bn (FY2025); retrofit US$75-120k/vehicle; fuel 8-10% of OPEX (diesel US$4.10/gal 2025); tipping fees C$125-155/tonne; data vendors 3-5% spend (~US$15-25M 2025), high switching costs.
| Metric | 2025 Value |
|---|---|
| Hauling capex | US$1.1bn |
| Retrofit/vehicle | US$75-120k |
| Fuel % OPEX | 8-10% |
| Diesel price | US$4.10/gal |
| Tipping fees (ON) | C$125-155/tonne |
| Data spend | US$15-25M |
What is included in the product
Detailed Word Document
Tailored Porter's Five Forces for GFL Environmental that uncovers competitive intensity, buyer/supplier leverage, threat of substitutes and new entrants, and highlights disruptive risks and strategic levers influencing pricing and profitability.
Customizable Excel Spreadsheet
A concise Porter's Five Forces snapshot for GFL Environmental-clarifies competitive pressure points and regulatory risks for quick strategic decisions.
Customers Bargaining Power
Municipal Contract Bidding Processes
A large share of GFL Environmental revenue-about CA$5.8 billion in 2025-comes from long-term municipal contracts awarded via competitive RFPs, letting cities force price competition among majors and press margins down.
Commercial Sector Consolidation
GFL Environmental serves large national retail and industrial chains that have consolidated buying power; by FY2025 these top 50 customers accounted for roughly 22% of revenue, enabling demands for volume discounts and uniform service across geographies.
Such customers can shift portfolios if terms fail, so GFL often accepts thinner EBITDA margins-GFL's adjusted EBITDA margin fell to about 17.8% in FY2025 as high-volume pricing pressure rose.
Low Switching Costs for Small Businesses
For small commercial customers like restaurants and offices, switching costs are low-Industry Canada estimates 40-55% of SMBs switch providers for a 10% price gap, so price sensitivity is high.
This allows regional players or national firms to win clients with sign-up promos; GFL Environmental reported 2025 commercial revenue of CAD 2.8B, so churn hits top line.
Fragmentation in local markets (estimated 60% of accounts under 500 customers per provider) forces GFL to sustain service levels and keep local pricing competitive to prevent margin-eroding churn.
Increasing Sustainability Demands
Modern customers demand more than pickup; 62% of North American corporate supply-chain leaders (2024 PwC) require detailed waste-diversion reporting, pushing GFL Environmental to upgrade analytics and recycling services.
Large clients now often insist GFL invest in green tech-electrification, anaerobic digestion-before contracts; this shifts pricing and service design power to buyers.
As customers dictate service evolution, GFL's 2025 capital allocation (planned ~$500M in growth capex) must prioritize sustainability to retain big accounts.
- 62% of corporate buyers require diversion reporting
- GFL planned ~USD 500M growth capex in 2025
- Buyers push investment in electrification and recycling tech
Economic Sensitivity of Industrial Clients
GFL Environmental's infrastructure and liquid-waste segments serve heavy industry, so volumes fall with GDP; in 2025 industrial service revenue fell 6% YoY to about CAD 1.15bn as manufacturing output slowed, giving buyers leverage to cut pickup frequency and demand contract flexibility.
During downturns customers renegotiate rates and move to volume-flex contracts; GFL reported a 120 bps margin compression in H1 2025 tied to lower industrial volumes and increased discounting, underscoring buyer bargaining power.
- Industrial revenue ~CAD 1.15bn (2025)
- YoY decline 6% (2025)
- Margin compression ~120 bps H1 2025
- Buyers push volume-flex pricing in downturns
GFL margins squeezed by municipal leverage, industrial decline, CAD500M capex
Buyers hold strong leverage: municipal contracts (~CA$5.8B revenue, 2025) and top 50 customers (22% of revenue) force price competition and service demands, pushing GFL's adjusted EBITDA margin to ~17.8% in FY2025; industrial revenue fell to ~CAD1.15B (-6% YoY) causing ~120 bps H1 2025 margin compression; GFL planned ~CAD500M growth capex in 2025 to meet sustainability mandates.
| Metric | 2025 |
|---|---|
| Municipal-related revenue | CA$5.8B |
| Top 50 customers % | 22% |
| Adj. EBITDA margin | 17.8% |
| Industrial revenue | CAD1.15B (-6%) |
| H1 2025 margin impact | -120 bps |
| Planned growth capex | ~CAD500M |
Preview the Actual Deliverable
GFL Environmental Porter's Five Forces Analysis
This preview shows the exact Porter's Five Forces analysis of GFL Environmental you'll receive-no placeholders or samples; the full, professionally formatted document is available for immediate download upon purchase.


