
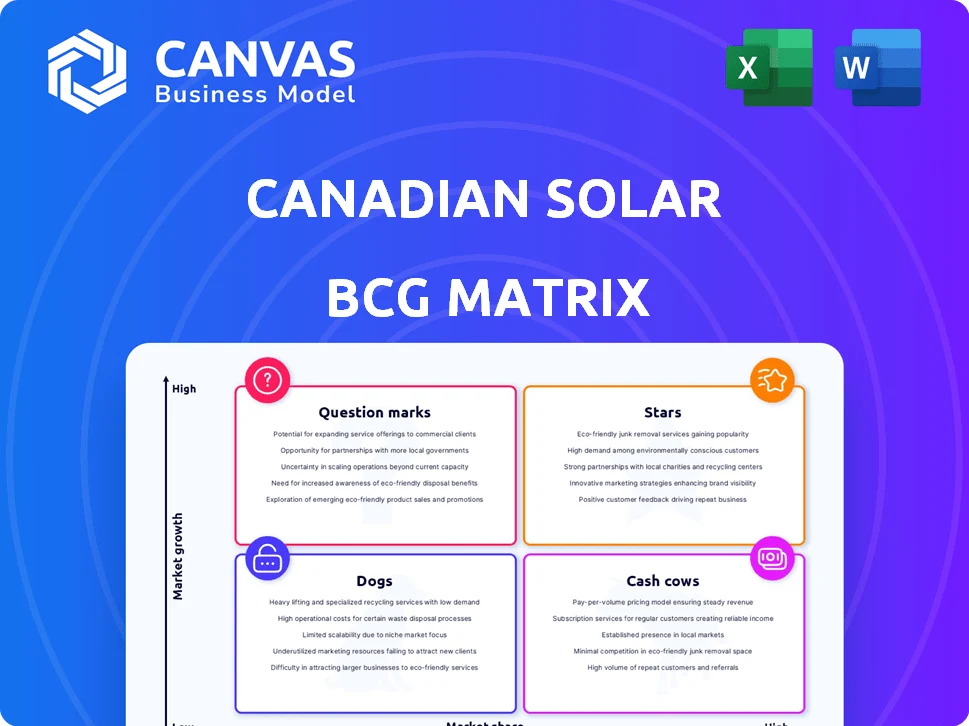
CANADIAN SOLAR BCG MATRIX TEMPLATE RESEARCH

See the Bigger Picture
Canadian Solar's product and project portfolio sits at the intersection of rapid market growth and margin pressure-some segments behave like Stars with expanding utility-scale pipelines, while others resemble Cash Cows tied to long-term module contracts; a few nascent technologies may be Question Marks needing capital decisions. This snapshot hints at strategic tradeoffs across manufacturing scale, geographic exposure, and project development risk. Purchase the full BCG Matrix for a quadrant-by-quadrant breakdown, data-backed recommendations, and ready-to-use Word and Excel deliverables to guide allocation and competitive moves.
Stars

e-STORAGE Utility Solutions
e-STORAGE Utility Solutions is Canadian Solar's breakout leader with a $3.1 billion contracted backlog as of October 31, 2025; it shipped a record 2.7 GWh in Q3 2025 and its global development pipeline is 81 GWh, capturing top market share in fast-growing energy storage.
Recurrent Energy Project Development
Recurrent Energy, Canadian Solar's utility-scale arm, holds a 25 GWp global solar pipeline and 73 GWh of storage capacity as of late 2025, positioning it as a star in the BCG matrix.
BlackRock's $500 million investment in 2025 boosts institutional confidence and funds Recurrent's shift to an IPP model.
Pairing large-scale solar with 73 GWh storage raises project valuations and improves grid stability, driving high growth and margin expansion.

N-Type TOPCon High-Efficiency Modules
Canadian Solar's shift to N-type TOPCon, including TOPBiHiKu7, solidifies its Star status with 61 GW annual capacity by end-2025 and module efficiencies up to 24.8%, displacing PERC in utility-scale bids.
These TOPCon panels command premium pricing-realized ASPs ~0.24-0.28 USD/W in 2025-and drive higher-margin sales in North American and European utility markets.

U.S. Manufacturing Hubs (Indiana and Kentucky)
Canadian Solar is localizing supply via a 2026 solar-cell plant in Indiana and a 2026 lithium-battery plant in Kentucky to qualify for Domestic Content Bonus credits, creating a high-market-share moat versus imports and targeting the lucrative U.S. market where utility-scale solar grew 35% in 2024.
These sites back a strategic push after Canadian Solar reported $4.1B revenue in FY2025, with U.S. project backlog ~ $1.2B, making the investments critical to protect margins and capture higher incentive-driven pricing.
- Indiana cell plant: production start 2026; secures DCB eligibility
- Kentucky battery plant: production start 2026; supports storage bids
- FY2025 revenue: $4.1 billion; U.S. backlog ≈ $1.2 billion
- U.S. utility-scale solar growth: ~35% in 2024, boosting demand
SolBank 3.0 Plus Series
The SolBank 3.0 Plus, launched mid-2025, is Canadian Solar's flagship e‑STORAGE product for large-scale grid use, offering active cell‑level balancing and >250 Wh/kg energy density to meet data center and utility specs.
It drives fulfillment of Canadian Solar's multi‑billion‑dollar storage backlog-approximately US$3.2B in contracted storage revenue as of Dec 2025-and targets high‑margin utility contracts.
- Launch: mid‑2025
- Energy density: >250 Wh/kg
- Features: active cell‑level balancing
- Backlog impact: ~US$3.2B (Dec 2025)
Storage-led surge: $3.2B backlog, 81GWh pipeline, Recurrent 25GWp - FY25 revenue $4.1B
Stars: e‑STORAGE Utility and Recurrent Energy lead growth-$3.2B storage backlog (Dec 2025), 81 GWh dev. pipeline, 2.7 GWh Q3'25 shipments; Recurrent: 25 GWp solar pipeline, 73 GWh storage; TOPCon capacity 61 GW (end‑2025), ASPs $0.24-0.28/W; FY2025 revenue $4.1B; U.S. backlog $1.2B.
| Metric | Value (2025) |
|---|---|
| Storage backlog | $3.2B |
| Dev. pipeline | 81 GWh |
| Recurrent pipeline | 25 GWp / 73 GWh |
| TOPCon capacity | 61 GW |
| ASP (modules) | $0.24-0.28/W |
| FY2025 revenue | $4.1B |
| U.S. backlog | $1.2B |
What is included in the product
 Detailed Word Document
Comprehensive BCG Matrix assessment of Canadian Solar's segments with strategic actions, risks, and macro/micro context per quadrant.

 Customizable Excel Spreadsheet
One-page overview placing each Canadian Solar business unit in a BCG quadrant for instant strategic clarity.
Cash Cows

Legacy Utility-Scale Solar Modules
Standard monocrystalline utility modules remain Canadian Solar's high-volume workhorse, projected to underlie roughly $5.6-$6.3 billion in 2025 revenue, with modules likely contributing ~60-70% of product sales (~$3.4-$4.4B).
Market growth is mature and module ASPs fell ~8% YoY in 2025, but Canadian Solar's Tier‑1 bankability sustains steady cash from long-term utility contracts.
These shipments deliver predictable operating cash flow-supporting capex and funding R&D and storage investments where Canadian Solar aims for mid‑teens CAGR.
Global Operations and Maintenance (O&M) Services
Canadian Solar's Global O&M services manage over 14 GW of solar and storage under long-term contracts as of late 2025, delivering high-margin, recurring revenue with gross margins typically above 30% and EBITDA margins near 20% in 2025.

Established IPP Portfolio
Canadian Solar's established IPP portfolio generated record electricity sales revenue of CAD 1.12 billion in fiscal 2025, driven by 4.3 GW of operational capacity across solar and storage.
Keeping ~35% of developed projects on balance sheet lets Canadian Solar lock long-term cash flows via PPAs averaging 12 years, boosting predictable revenue.
These mature assets need minimal marketing and produced free cash flow of CAD 310 million in 2025, funding debt service and dividends.

North American Residential Solar Kits
Canadian Solar's North American residential solar kits are cash cows: despite a sector slowdown, they hold a mature market share through standardized kits and two decades of optimized distribution, driving low promo costs and steady volumes.
In 2025 the segment kept contributing to blended gross margin, which stabilized around 17.2% in Q3, with kit gross margins ~18-19% and annual kit revenues ≈USD 230-260m.
- Mature market share: high retention, low acquisition cost
- Operational efficiency: 20+ years distribution scale
- 2025 Q3 blended gross margin: ~17.2%
- Kit gross margin: ~18-19%; revenue: USD 230-260m (2025)
Standard Inverter and PCS Solutions
Canadian Solar's self-developed CSI inverter range (15-350 kW) is a cash cow: bundled with modules it drove 2025 system sales that contributed roughly US$420M in hardware revenue, showing mid-single-digit volume growth and steady gross margins near 18%.
As a mature product line it needs limited capex (R&D down 12% YoY to US$14M in 2025) while supplying reliable margins and reinforcing one-stop-shop sales to C&I and utility customers.
- CSI inverters: 15-350 kW, bundled with modules
- 2025 hardware revenue contribution: ~US$420M
- Gross margin: ~18% in 2025
- R&D spend: US$14M (2025), down 12% YoY
- Mature product: low incremental investment, steady cash generation
Canadian Solar 2025: $3.9B modules, CAD1.12B IPP, CAD310M FCF - strong margins, 12yr PPAs
Canadian Solar's module, O&M, IPP, residential kits and CSI inverters generated steady 2025 cash: modules ~$3.9B, O&M >14GW/30% gross, IPP revenue CAD1.12B (4.3GW), kits USD≈245M (18-19% GM), CSI hardware US$420M (18% GM); FCF CAD310M; PPAs avg 12 yrs.
| Segment | 2025 Value | Margin/Notes |
|---|---|---|
| Modules | $3.9B | 60-70% product sales |
| O&M | 14+GW | Gross >30% |
| IPP | CAD1.12B | 4.3GW ops |
| Kits | USD245M | GM 18-19% |
| CSI inverters | US$420M | GM ~18% |
| FCF | CAD310M | PPAs ~12 yrs |
Full Transparency, Always
Canadian Solar BCG Matrix
The file you're previewing on this page is the final Canadian Solar BCG Matrix you'll receive after purchase-no watermarks, no demo content-just a fully formatted, analysis-ready report designed for strategic clarity and professional use.

Original: $10.00
-65%$10.00
$3.50CANADIAN SOLAR BCG MATRIX TEMPLATE RESEARCH
See the Bigger Picture
Canadian Solar's product and project portfolio sits at the intersection of rapid market growth and margin pressure-some segments behave like Stars with expanding utility-scale pipelines, while others resemble Cash Cows tied to long-term module contracts; a few nascent technologies may be Question Marks needing capital decisions. This snapshot hints at strategic tradeoffs across manufacturing scale, geographic exposure, and project development risk. Purchase the full BCG Matrix for a quadrant-by-quadrant breakdown, data-backed recommendations, and ready-to-use Word and Excel deliverables to guide allocation and competitive moves.
Stars
e-STORAGE Utility Solutions
e-STORAGE Utility Solutions is Canadian Solar's breakout leader with a $3.1 billion contracted backlog as of October 31, 2025; it shipped a record 2.7 GWh in Q3 2025 and its global development pipeline is 81 GWh, capturing top market share in fast-growing energy storage.
Recurrent Energy Project Development
Recurrent Energy, Canadian Solar's utility-scale arm, holds a 25 GWp global solar pipeline and 73 GWh of storage capacity as of late 2025, positioning it as a star in the BCG matrix.
BlackRock's $500 million investment in 2025 boosts institutional confidence and funds Recurrent's shift to an IPP model.
Pairing large-scale solar with 73 GWh storage raises project valuations and improves grid stability, driving high growth and margin expansion.
N-Type TOPCon High-Efficiency Modules
Canadian Solar's shift to N-type TOPCon, including TOPBiHiKu7, solidifies its Star status with 61 GW annual capacity by end-2025 and module efficiencies up to 24.8%, displacing PERC in utility-scale bids.
These TOPCon panels command premium pricing-realized ASPs ~0.24-0.28 USD/W in 2025-and drive higher-margin sales in North American and European utility markets.
U.S. Manufacturing Hubs (Indiana and Kentucky)
Canadian Solar is localizing supply via a 2026 solar-cell plant in Indiana and a 2026 lithium-battery plant in Kentucky to qualify for Domestic Content Bonus credits, creating a high-market-share moat versus imports and targeting the lucrative U.S. market where utility-scale solar grew 35% in 2024.
These sites back a strategic push after Canadian Solar reported $4.1B revenue in FY2025, with U.S. project backlog ~ $1.2B, making the investments critical to protect margins and capture higher incentive-driven pricing.
- Indiana cell plant: production start 2026; secures DCB eligibility
- Kentucky battery plant: production start 2026; supports storage bids
- FY2025 revenue: $4.1 billion; U.S. backlog ≈ $1.2 billion
- U.S. utility-scale solar growth: ~35% in 2024, boosting demand
SolBank 3.0 Plus Series
The SolBank 3.0 Plus, launched mid-2025, is Canadian Solar's flagship e‑STORAGE product for large-scale grid use, offering active cell‑level balancing and >250 Wh/kg energy density to meet data center and utility specs.
It drives fulfillment of Canadian Solar's multi‑billion‑dollar storage backlog-approximately US$3.2B in contracted storage revenue as of Dec 2025-and targets high‑margin utility contracts.
- Launch: mid‑2025
- Energy density: >250 Wh/kg
- Features: active cell‑level balancing
- Backlog impact: ~US$3.2B (Dec 2025)
Storage-led surge: $3.2B backlog, 81GWh pipeline, Recurrent 25GWp - FY25 revenue $4.1B
Stars: e‑STORAGE Utility and Recurrent Energy lead growth-$3.2B storage backlog (Dec 2025), 81 GWh dev. pipeline, 2.7 GWh Q3'25 shipments; Recurrent: 25 GWp solar pipeline, 73 GWh storage; TOPCon capacity 61 GW (end‑2025), ASPs $0.24-0.28/W; FY2025 revenue $4.1B; U.S. backlog $1.2B.
| Metric | Value (2025) |
|---|---|
| Storage backlog | $3.2B |
| Dev. pipeline | 81 GWh |
| Recurrent pipeline | 25 GWp / 73 GWh |
| TOPCon capacity | 61 GW |
| ASP (modules) | $0.24-0.28/W |
| FY2025 revenue | $4.1B |
| U.S. backlog | $1.2B |
What is included in the product
Detailed Word Document
Comprehensive BCG Matrix assessment of Canadian Solar's segments with strategic actions, risks, and macro/micro context per quadrant.
Customizable Excel Spreadsheet
One-page overview placing each Canadian Solar business unit in a BCG quadrant for instant strategic clarity.
Cash Cows
Legacy Utility-Scale Solar Modules
Standard monocrystalline utility modules remain Canadian Solar's high-volume workhorse, projected to underlie roughly $5.6-$6.3 billion in 2025 revenue, with modules likely contributing ~60-70% of product sales (~$3.4-$4.4B).
Market growth is mature and module ASPs fell ~8% YoY in 2025, but Canadian Solar's Tier‑1 bankability sustains steady cash from long-term utility contracts.
These shipments deliver predictable operating cash flow-supporting capex and funding R&D and storage investments where Canadian Solar aims for mid‑teens CAGR.
Global Operations and Maintenance (O&M) Services
Canadian Solar's Global O&M services manage over 14 GW of solar and storage under long-term contracts as of late 2025, delivering high-margin, recurring revenue with gross margins typically above 30% and EBITDA margins near 20% in 2025.
Established IPP Portfolio
Canadian Solar's established IPP portfolio generated record electricity sales revenue of CAD 1.12 billion in fiscal 2025, driven by 4.3 GW of operational capacity across solar and storage.
Keeping ~35% of developed projects on balance sheet lets Canadian Solar lock long-term cash flows via PPAs averaging 12 years, boosting predictable revenue.
These mature assets need minimal marketing and produced free cash flow of CAD 310 million in 2025, funding debt service and dividends.
North American Residential Solar Kits
Canadian Solar's North American residential solar kits are cash cows: despite a sector slowdown, they hold a mature market share through standardized kits and two decades of optimized distribution, driving low promo costs and steady volumes.
In 2025 the segment kept contributing to blended gross margin, which stabilized around 17.2% in Q3, with kit gross margins ~18-19% and annual kit revenues ≈USD 230-260m.
- Mature market share: high retention, low acquisition cost
- Operational efficiency: 20+ years distribution scale
- 2025 Q3 blended gross margin: ~17.2%
- Kit gross margin: ~18-19%; revenue: USD 230-260m (2025)
Standard Inverter and PCS Solutions
Canadian Solar's self-developed CSI inverter range (15-350 kW) is a cash cow: bundled with modules it drove 2025 system sales that contributed roughly US$420M in hardware revenue, showing mid-single-digit volume growth and steady gross margins near 18%.
As a mature product line it needs limited capex (R&D down 12% YoY to US$14M in 2025) while supplying reliable margins and reinforcing one-stop-shop sales to C&I and utility customers.
- CSI inverters: 15-350 kW, bundled with modules
- 2025 hardware revenue contribution: ~US$420M
- Gross margin: ~18% in 2025
- R&D spend: US$14M (2025), down 12% YoY
- Mature product: low incremental investment, steady cash generation
Canadian Solar 2025: $3.9B modules, CAD1.12B IPP, CAD310M FCF - strong margins, 12yr PPAs
Canadian Solar's module, O&M, IPP, residential kits and CSI inverters generated steady 2025 cash: modules ~$3.9B, O&M >14GW/30% gross, IPP revenue CAD1.12B (4.3GW), kits USD≈245M (18-19% GM), CSI hardware US$420M (18% GM); FCF CAD310M; PPAs avg 12 yrs.
| Segment | 2025 Value | Margin/Notes |
|---|---|---|
| Modules | $3.9B | 60-70% product sales |
| O&M | 14+GW | Gross >30% |
| IPP | CAD1.12B | 4.3GW ops |
| Kits | USD245M | GM 18-19% |
| CSI inverters | US$420M | GM ~18% |
| FCF | CAD310M | PPAs ~12 yrs |
Full Transparency, Always
Canadian Solar BCG Matrix
The file you're previewing on this page is the final Canadian Solar BCG Matrix you'll receive after purchase-no watermarks, no demo content-just a fully formatted, analysis-ready report designed for strategic clarity and professional use.
Product Information
Product Information
Shipping & Returns
Shipping & Returns
Description
See the Bigger Picture
Canadian Solar's product and project portfolio sits at the intersection of rapid market growth and margin pressure-some segments behave like Stars with expanding utility-scale pipelines, while others resemble Cash Cows tied to long-term module contracts; a few nascent technologies may be Question Marks needing capital decisions. This snapshot hints at strategic tradeoffs across manufacturing scale, geographic exposure, and project development risk. Purchase the full BCG Matrix for a quadrant-by-quadrant breakdown, data-backed recommendations, and ready-to-use Word and Excel deliverables to guide allocation and competitive moves.
Stars
e-STORAGE Utility Solutions
e-STORAGE Utility Solutions is Canadian Solar's breakout leader with a $3.1 billion contracted backlog as of October 31, 2025; it shipped a record 2.7 GWh in Q3 2025 and its global development pipeline is 81 GWh, capturing top market share in fast-growing energy storage.
Recurrent Energy Project Development
Recurrent Energy, Canadian Solar's utility-scale arm, holds a 25 GWp global solar pipeline and 73 GWh of storage capacity as of late 2025, positioning it as a star in the BCG matrix.
BlackRock's $500 million investment in 2025 boosts institutional confidence and funds Recurrent's shift to an IPP model.
Pairing large-scale solar with 73 GWh storage raises project valuations and improves grid stability, driving high growth and margin expansion.
N-Type TOPCon High-Efficiency Modules
Canadian Solar's shift to N-type TOPCon, including TOPBiHiKu7, solidifies its Star status with 61 GW annual capacity by end-2025 and module efficiencies up to 24.8%, displacing PERC in utility-scale bids.
These TOPCon panels command premium pricing-realized ASPs ~0.24-0.28 USD/W in 2025-and drive higher-margin sales in North American and European utility markets.
U.S. Manufacturing Hubs (Indiana and Kentucky)
Canadian Solar is localizing supply via a 2026 solar-cell plant in Indiana and a 2026 lithium-battery plant in Kentucky to qualify for Domestic Content Bonus credits, creating a high-market-share moat versus imports and targeting the lucrative U.S. market where utility-scale solar grew 35% in 2024.
These sites back a strategic push after Canadian Solar reported $4.1B revenue in FY2025, with U.S. project backlog ~ $1.2B, making the investments critical to protect margins and capture higher incentive-driven pricing.
- Indiana cell plant: production start 2026; secures DCB eligibility
- Kentucky battery plant: production start 2026; supports storage bids
- FY2025 revenue: $4.1 billion; U.S. backlog ≈ $1.2 billion
- U.S. utility-scale solar growth: ~35% in 2024, boosting demand
SolBank 3.0 Plus Series
The SolBank 3.0 Plus, launched mid-2025, is Canadian Solar's flagship e‑STORAGE product for large-scale grid use, offering active cell‑level balancing and >250 Wh/kg energy density to meet data center and utility specs.
It drives fulfillment of Canadian Solar's multi‑billion‑dollar storage backlog-approximately US$3.2B in contracted storage revenue as of Dec 2025-and targets high‑margin utility contracts.
- Launch: mid‑2025
- Energy density: >250 Wh/kg
- Features: active cell‑level balancing
- Backlog impact: ~US$3.2B (Dec 2025)
Storage-led surge: $3.2B backlog, 81GWh pipeline, Recurrent 25GWp - FY25 revenue $4.1B
Stars: e‑STORAGE Utility and Recurrent Energy lead growth-$3.2B storage backlog (Dec 2025), 81 GWh dev. pipeline, 2.7 GWh Q3'25 shipments; Recurrent: 25 GWp solar pipeline, 73 GWh storage; TOPCon capacity 61 GW (end‑2025), ASPs $0.24-0.28/W; FY2025 revenue $4.1B; U.S. backlog $1.2B.
| Metric | Value (2025) |
|---|---|
| Storage backlog | $3.2B |
| Dev. pipeline | 81 GWh |
| Recurrent pipeline | 25 GWp / 73 GWh |
| TOPCon capacity | 61 GW |
| ASP (modules) | $0.24-0.28/W |
| FY2025 revenue | $4.1B |
| U.S. backlog | $1.2B |
What is included in the product
Detailed Word Document
Comprehensive BCG Matrix assessment of Canadian Solar's segments with strategic actions, risks, and macro/micro context per quadrant.
Customizable Excel Spreadsheet
One-page overview placing each Canadian Solar business unit in a BCG quadrant for instant strategic clarity.
Cash Cows
Legacy Utility-Scale Solar Modules
Standard monocrystalline utility modules remain Canadian Solar's high-volume workhorse, projected to underlie roughly $5.6-$6.3 billion in 2025 revenue, with modules likely contributing ~60-70% of product sales (~$3.4-$4.4B).
Market growth is mature and module ASPs fell ~8% YoY in 2025, but Canadian Solar's Tier‑1 bankability sustains steady cash from long-term utility contracts.
These shipments deliver predictable operating cash flow-supporting capex and funding R&D and storage investments where Canadian Solar aims for mid‑teens CAGR.
Global Operations and Maintenance (O&M) Services
Canadian Solar's Global O&M services manage over 14 GW of solar and storage under long-term contracts as of late 2025, delivering high-margin, recurring revenue with gross margins typically above 30% and EBITDA margins near 20% in 2025.
Established IPP Portfolio
Canadian Solar's established IPP portfolio generated record electricity sales revenue of CAD 1.12 billion in fiscal 2025, driven by 4.3 GW of operational capacity across solar and storage.
Keeping ~35% of developed projects on balance sheet lets Canadian Solar lock long-term cash flows via PPAs averaging 12 years, boosting predictable revenue.
These mature assets need minimal marketing and produced free cash flow of CAD 310 million in 2025, funding debt service and dividends.
North American Residential Solar Kits
Canadian Solar's North American residential solar kits are cash cows: despite a sector slowdown, they hold a mature market share through standardized kits and two decades of optimized distribution, driving low promo costs and steady volumes.
In 2025 the segment kept contributing to blended gross margin, which stabilized around 17.2% in Q3, with kit gross margins ~18-19% and annual kit revenues ≈USD 230-260m.
- Mature market share: high retention, low acquisition cost
- Operational efficiency: 20+ years distribution scale
- 2025 Q3 blended gross margin: ~17.2%
- Kit gross margin: ~18-19%; revenue: USD 230-260m (2025)
Standard Inverter and PCS Solutions
Canadian Solar's self-developed CSI inverter range (15-350 kW) is a cash cow: bundled with modules it drove 2025 system sales that contributed roughly US$420M in hardware revenue, showing mid-single-digit volume growth and steady gross margins near 18%.
As a mature product line it needs limited capex (R&D down 12% YoY to US$14M in 2025) while supplying reliable margins and reinforcing one-stop-shop sales to C&I and utility customers.
- CSI inverters: 15-350 kW, bundled with modules
- 2025 hardware revenue contribution: ~US$420M
- Gross margin: ~18% in 2025
- R&D spend: US$14M (2025), down 12% YoY
- Mature product: low incremental investment, steady cash generation
Canadian Solar 2025: $3.9B modules, CAD1.12B IPP, CAD310M FCF - strong margins, 12yr PPAs
Canadian Solar's module, O&M, IPP, residential kits and CSI inverters generated steady 2025 cash: modules ~$3.9B, O&M >14GW/30% gross, IPP revenue CAD1.12B (4.3GW), kits USD≈245M (18-19% GM), CSI hardware US$420M (18% GM); FCF CAD310M; PPAs avg 12 yrs.
| Segment | 2025 Value | Margin/Notes |
|---|---|---|
| Modules | $3.9B | 60-70% product sales |
| O&M | 14+GW | Gross >30% |
| IPP | CAD1.12B | 4.3GW ops |
| Kits | USD245M | GM 18-19% |
| CSI inverters | US$420M | GM ~18% |
| FCF | CAD310M | PPAs ~12 yrs |
Full Transparency, Always
Canadian Solar BCG Matrix
The file you're previewing on this page is the final Canadian Solar BCG Matrix you'll receive after purchase-no watermarks, no demo content-just a fully formatted, analysis-ready report designed for strategic clarity and professional use.









