
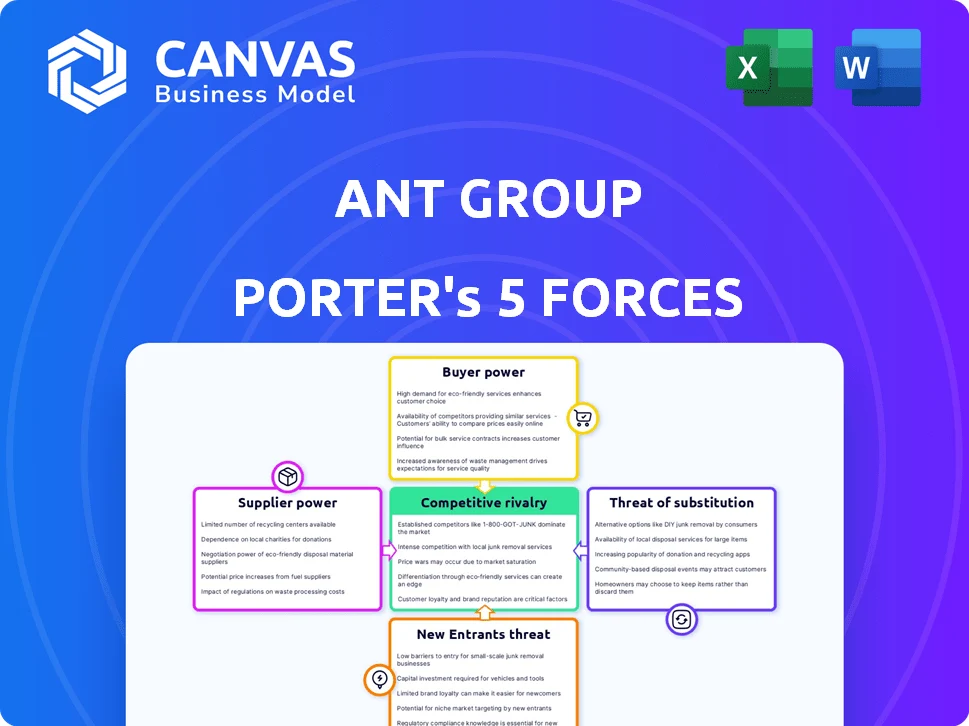
ANT GROUP PORTER'S FIVE FORCES TEMPLATE RESEARCH

A Must-Have Tool for Decision-Makers
Ant Group faces intense rivalry from fintech incumbents and Big Tech, moderate supplier power but high regulatory and new-entrant threats, and buyer leverage driven by platform switching-this snapshot highlights strategic tensions and growth levers.
Unlock the full Porter's Five Forces Analysis to explore force-by-force ratings, visuals, and actionable insights tailored to Ant Group's competitive landscape.
Suppliers Bargaining Power

Concentrated Financial Institution Partnerships
Ant Group depends on ~100 partner banks and ~170 asset managers to underwrite loans and offer funds; in 2025 these partners provided ~¥1.2 trillion (~$165bn) of off‑balance liquidity, giving them strong leverage over Ant's CreditTech and wealth segments.
Dominance of State-Owned Entities
Key suppliers of regulatory legitimacy and infrastructure-state-owned banks and the People's Bank of China (PBOC)-hold decisive leverage over Ant Group after its 2020-25 restructuring into a financial holding company; Beijing's direct stakes and oversight mean the state acts as the ultimate supplier of operating rights.
This limits Ant's bargaining on data sharing and pricing: by end-2025 state entities held roughly 12-18% direct/indirect stakes and regulators imposed ceilings such as the PBOC-guided loan prime rate link and data residency rules.
As a result, Ant faces constrained autonomy on interest-rate-related products and mandatory data access terms, reducing its supplier-negotiation power and compressing potential margins.

Cloud and AI Infrastructure Costs
Ant Group's AI-native payments like Alipay AI Pay drive massive compute: in FY2025 Ant reported ~¥48.2 billion in R&D and cloud-related tech spend, forcing heavy use of advanced semiconductors and AI accelerators.
Global supply tightness and export controls give suppliers high bargaining power-NVIDIA's data-center GPU ASPs rose ~12% in 2025, and China-focused AI chip imports faced quotas, raising Ant's sourcing costs.
Ant's 2026 push into Agentic AI further concentrates demand on specialized chips and cloud tiers, increasing single-vendor risk and negotiating leverage for suppliers unless Ant invests in in-house silicon or multi-cloud diversification.

Talent Scarcity in Fintech and AI
Talent scarcity in AI and financial-security engineering gives top candidates strong bargaining power; Ant Group reported R&D spend of RMB 23.8 billion in FY2025, up 18% year-over-year, largely driven by hiring and retention costs.
Competing globally with Google and Tencent for niche AI talent during Ant Group's international push raises average total compensation by an estimated 20-30%, squeezing margins.
Higher pay and recruitment intensity force trade-offs: slower margin recovery or reallocating capital from other growth projects to talent retention.
- R&D spend FY2025: RMB 23.8bn
- Compensation uplift vs peers: +20-30%
- YOY R&D growth: +18%
Dependence on Global Payment Networks
Ant International relies on Visa and Mastercard for cross-border tap-to-pay reach; despite Alipay+ rollout, global networks control merchant rails and can set interchange fees and access terms that affect margins.
In 2025 Ant Group reported 1.5 billion annual active users globally, yet <0.5% of Western POS transactions use Alipay+, exposing dependence on incumbents.
- Visa/Mastercard control ~80% of global card rails
- Interchange fees can be 1-3% of transaction value
- Alipay+ needs network cooperation for Western merchant acceptance
Suppliers Drive Liquidity; State Holds 12-18% Influence as R&D, GPUs, Cards Gain
Suppliers wield high power: partner banks/asset managers supplied ~¥1.2T (~$165B) off‑balance liquidity in 2025; state (PBOC/state banks) held ~12-18% influence and regulatory levers; FY2025 R&D/cloud spend ¥48.2B (R&D ¥23.8B); NVIDIA GPU ASPs +12% in 2025; Visa/Mastercard ~80% rail share.
| Metric | 2025 value |
|---|---|
| Off‑balance liquidity | ¥1.2T (~$165B) |
| State stake/ influence | 12-18% |
| R&D spend | ¥23.8B |
| R&D+cloud spend | ¥48.2B |
| NVIDIA GPU ASP change | +12% |
| Visa/Mastercard rail share | ~80% |
What is included in the product
 Detailed Word Document
Tailored Porter's Five Forces for Ant Group, highlighting competitive intensity, buyer/supplier leverage, barriers to entry, and threats from substitutes and fintech disruptors, with strategic implications for pricing, profitability, and market defense.

 Customizable Excel Spreadsheet
A concise Porter's Five Forces snapshot for Ant Group-distills competitive pressures into a single page to speed strategic choices and boardroom decisions.
Customers Bargaining Power

Low Switching Costs for Consumers
The average Chinese consumer uses both Alipay and WeChat Pay, so switching costs are near zero; the 2024 PBOC survey showed 94% of urban users hold two or more e-wallets, pressuring Ant Group to retain users.
Regulatory 'unbundling' since 2021 ended product lock-in for lending and wealth management, and Ant's MYBank loans fell 18% YoY in 2025, showing user mobility.
This high mobility forces Ant Group to spend on UX and incentives-marketing and R&D rose to RMB 42.3 billion in FY2025-to reduce churn.
High Price Sensitivity in SME Lending
Ant serves 150 million merchants, ~90% SMEs - a 2025 lending book exposure of about $28 billion to SME segments, making borrowers highly price-sensitive to fees and rates.
2026 caps limiting consumer loan rates to 4× the loan prime rate strengthen SME bargaining power by compressing pricing flexibility and margin for Ant.
SMEs can switch to JD.com or Meituan quickly; Ant lost ~0.8 pp merchant engagement in 2025 where rival offers undercut financing costs.

Increased Financial Literacy and Choice
As digital finance matures, Chinese retail customers compare wealth yields and insurance premiums more narrowly; a 2025 Bain survey found 62% of users regularly use comparison tools, up from 41% in 2020, pressuring Ant Group to match returns and rates. Third-party aggregators now list products from Alipay and rivals side-by-side, eroding Ant's ecosystem lock-in and forcing price and yield competition. This transparency means Ant must prove superior net interest spreads and fee structures-Ant Group's 2025 consumer finance revenue of RMB 58.3 billion faces direct comparability against peers. If Ant's mutual fund average 1-year return lags market leaders by 0.5-1.0 percentage points, customer churn risk rises materially.

Bargaining Power of Large Merchants
Major retail chains and e-commerce platforms (e.g., Alibaba's Tmall, JD.com) negotiate fees with Ant Group; in 2025 top merchants processing >¥200bn annually can secure discounts cutting take-rate by 10-40bps, pressuring Ant's margins.
These mega-buyers can shift volume to rival wallets or closed-loop systems; Alibaba-owned ecosystem still accounted for ~45% of Ant's mainland China volumes in FY2025, so migration risk is meaningful.
Margin squeeze: Ant's payment processing EBITDA margin fell to ~28% in FY2025 vs 32% in FY2023, partly due to large-merchant discounts and promotional fee cuts.
- Top merchants (>¥200bn): 10-40bps discount
- Alibaba ecosystem: ~45% of volume (FY2025)
- EBITDA margin: 28% (FY2025) vs 32% (FY2023)
Collective Influence via Regulatory Protection
Regulatory consumer-protection reforms have turned customers into a collective bargaining force, with China's 2024 Anti-Monopoly and Consumer Protection updates capping data use and banning 'improper links' that favored Ant Group's lending partners.
Enforced app neutrality means users choose services by merit; Ant's 2025 digital-loan referrals fell ~28% YoY, shifting fee revenue and bargaining leverage to consumers.
- 2024 regs limit data reuse, reducing targeted push rates
- Ban on improper links cut Ant referral volume ~28% in 2025
- App neutrality raises switching rates, lowering platform lock-in
Ant Group margins squeezed as multi-wallet users, price-sensitive SMEs force cut to 28% EBITDA
Customers hold multiple e-wallets (94% 2024 PBOC), compare yields (62% use tools in 2025), and SMEs are price-sensitive (SME lending exposure ~$28bn FY2025), forcing Ant Group to cut take-rates (top merchants get 10-40bps) and invest RMB 42.3bn in marketing/R&D (FY2025), squeezing payment EBITDA to 28% (FY2025).
| Metric | Value (FY2025/2025) |
|---|---|
| Multi-wallet users | 94% (2024 PBOC) |
| User comparison tools | 62% (2025 Bain) |
| SME lending exposure | $28bn |
| Marketing & R&D | RMB 42.3bn |
| Payment EBITDA margin | 28% |
| Top-merchant discounts | 10-40bps |
Same Document Delivered
Ant Group Porter's Five Forces Analysis
This preview shows the exact Ant Group Porter's Five Forces analysis you'll receive immediately after purchase-no placeholders, no mockups, fully formatted and ready for download and use.

ANT GROUP PORTER'S FIVE FORCES TEMPLATE RESEARCH
A Must-Have Tool for Decision-Makers
Ant Group faces intense rivalry from fintech incumbents and Big Tech, moderate supplier power but high regulatory and new-entrant threats, and buyer leverage driven by platform switching-this snapshot highlights strategic tensions and growth levers.
Unlock the full Porter's Five Forces Analysis to explore force-by-force ratings, visuals, and actionable insights tailored to Ant Group's competitive landscape.
Suppliers Bargaining Power
Concentrated Financial Institution Partnerships
Ant Group depends on ~100 partner banks and ~170 asset managers to underwrite loans and offer funds; in 2025 these partners provided ~¥1.2 trillion (~$165bn) of off‑balance liquidity, giving them strong leverage over Ant's CreditTech and wealth segments.
Dominance of State-Owned Entities
Key suppliers of regulatory legitimacy and infrastructure-state-owned banks and the People's Bank of China (PBOC)-hold decisive leverage over Ant Group after its 2020-25 restructuring into a financial holding company; Beijing's direct stakes and oversight mean the state acts as the ultimate supplier of operating rights.
This limits Ant's bargaining on data sharing and pricing: by end-2025 state entities held roughly 12-18% direct/indirect stakes and regulators imposed ceilings such as the PBOC-guided loan prime rate link and data residency rules.
As a result, Ant faces constrained autonomy on interest-rate-related products and mandatory data access terms, reducing its supplier-negotiation power and compressing potential margins.
Cloud and AI Infrastructure Costs
Ant Group's AI-native payments like Alipay AI Pay drive massive compute: in FY2025 Ant reported ~¥48.2 billion in R&D and cloud-related tech spend, forcing heavy use of advanced semiconductors and AI accelerators.
Global supply tightness and export controls give suppliers high bargaining power-NVIDIA's data-center GPU ASPs rose ~12% in 2025, and China-focused AI chip imports faced quotas, raising Ant's sourcing costs.
Ant's 2026 push into Agentic AI further concentrates demand on specialized chips and cloud tiers, increasing single-vendor risk and negotiating leverage for suppliers unless Ant invests in in-house silicon or multi-cloud diversification.
Talent Scarcity in Fintech and AI
Talent scarcity in AI and financial-security engineering gives top candidates strong bargaining power; Ant Group reported R&D spend of RMB 23.8 billion in FY2025, up 18% year-over-year, largely driven by hiring and retention costs.
Competing globally with Google and Tencent for niche AI talent during Ant Group's international push raises average total compensation by an estimated 20-30%, squeezing margins.
Higher pay and recruitment intensity force trade-offs: slower margin recovery or reallocating capital from other growth projects to talent retention.
- R&D spend FY2025: RMB 23.8bn
- Compensation uplift vs peers: +20-30%
- YOY R&D growth: +18%
Dependence on Global Payment Networks
Ant International relies on Visa and Mastercard for cross-border tap-to-pay reach; despite Alipay+ rollout, global networks control merchant rails and can set interchange fees and access terms that affect margins.
In 2025 Ant Group reported 1.5 billion annual active users globally, yet <0.5% of Western POS transactions use Alipay+, exposing dependence on incumbents.
- Visa/Mastercard control ~80% of global card rails
- Interchange fees can be 1-3% of transaction value
- Alipay+ needs network cooperation for Western merchant acceptance
Suppliers Drive Liquidity; State Holds 12-18% Influence as R&D, GPUs, Cards Gain
Suppliers wield high power: partner banks/asset managers supplied ~¥1.2T (~$165B) off‑balance liquidity in 2025; state (PBOC/state banks) held ~12-18% influence and regulatory levers; FY2025 R&D/cloud spend ¥48.2B (R&D ¥23.8B); NVIDIA GPU ASPs +12% in 2025; Visa/Mastercard ~80% rail share.
| Metric | 2025 value |
|---|---|
| Off‑balance liquidity | ¥1.2T (~$165B) |
| State stake/ influence | 12-18% |
| R&D spend | ¥23.8B |
| R&D+cloud spend | ¥48.2B |
| NVIDIA GPU ASP change | +12% |
| Visa/Mastercard rail share | ~80% |
What is included in the product
Detailed Word Document
Tailored Porter's Five Forces for Ant Group, highlighting competitive intensity, buyer/supplier leverage, barriers to entry, and threats from substitutes and fintech disruptors, with strategic implications for pricing, profitability, and market defense.
Customizable Excel Spreadsheet
A concise Porter's Five Forces snapshot for Ant Group-distills competitive pressures into a single page to speed strategic choices and boardroom decisions.
Customers Bargaining Power
Low Switching Costs for Consumers
The average Chinese consumer uses both Alipay and WeChat Pay, so switching costs are near zero; the 2024 PBOC survey showed 94% of urban users hold two or more e-wallets, pressuring Ant Group to retain users.
Regulatory 'unbundling' since 2021 ended product lock-in for lending and wealth management, and Ant's MYBank loans fell 18% YoY in 2025, showing user mobility.
This high mobility forces Ant Group to spend on UX and incentives-marketing and R&D rose to RMB 42.3 billion in FY2025-to reduce churn.
High Price Sensitivity in SME Lending
Ant serves 150 million merchants, ~90% SMEs - a 2025 lending book exposure of about $28 billion to SME segments, making borrowers highly price-sensitive to fees and rates.
2026 caps limiting consumer loan rates to 4× the loan prime rate strengthen SME bargaining power by compressing pricing flexibility and margin for Ant.
SMEs can switch to JD.com or Meituan quickly; Ant lost ~0.8 pp merchant engagement in 2025 where rival offers undercut financing costs.
Increased Financial Literacy and Choice
As digital finance matures, Chinese retail customers compare wealth yields and insurance premiums more narrowly; a 2025 Bain survey found 62% of users regularly use comparison tools, up from 41% in 2020, pressuring Ant Group to match returns and rates. Third-party aggregators now list products from Alipay and rivals side-by-side, eroding Ant's ecosystem lock-in and forcing price and yield competition. This transparency means Ant must prove superior net interest spreads and fee structures-Ant Group's 2025 consumer finance revenue of RMB 58.3 billion faces direct comparability against peers. If Ant's mutual fund average 1-year return lags market leaders by 0.5-1.0 percentage points, customer churn risk rises materially.
Bargaining Power of Large Merchants
Major retail chains and e-commerce platforms (e.g., Alibaba's Tmall, JD.com) negotiate fees with Ant Group; in 2025 top merchants processing >¥200bn annually can secure discounts cutting take-rate by 10-40bps, pressuring Ant's margins.
These mega-buyers can shift volume to rival wallets or closed-loop systems; Alibaba-owned ecosystem still accounted for ~45% of Ant's mainland China volumes in FY2025, so migration risk is meaningful.
Margin squeeze: Ant's payment processing EBITDA margin fell to ~28% in FY2025 vs 32% in FY2023, partly due to large-merchant discounts and promotional fee cuts.
- Top merchants (>¥200bn): 10-40bps discount
- Alibaba ecosystem: ~45% of volume (FY2025)
- EBITDA margin: 28% (FY2025) vs 32% (FY2023)
Collective Influence via Regulatory Protection
Regulatory consumer-protection reforms have turned customers into a collective bargaining force, with China's 2024 Anti-Monopoly and Consumer Protection updates capping data use and banning 'improper links' that favored Ant Group's lending partners.
Enforced app neutrality means users choose services by merit; Ant's 2025 digital-loan referrals fell ~28% YoY, shifting fee revenue and bargaining leverage to consumers.
- 2024 regs limit data reuse, reducing targeted push rates
- Ban on improper links cut Ant referral volume ~28% in 2025
- App neutrality raises switching rates, lowering platform lock-in
Ant Group margins squeezed as multi-wallet users, price-sensitive SMEs force cut to 28% EBITDA
Customers hold multiple e-wallets (94% 2024 PBOC), compare yields (62% use tools in 2025), and SMEs are price-sensitive (SME lending exposure ~$28bn FY2025), forcing Ant Group to cut take-rates (top merchants get 10-40bps) and invest RMB 42.3bn in marketing/R&D (FY2025), squeezing payment EBITDA to 28% (FY2025).
| Metric | Value (FY2025/2025) |
|---|---|
| Multi-wallet users | 94% (2024 PBOC) |
| User comparison tools | 62% (2025 Bain) |
| SME lending exposure | $28bn |
| Marketing & R&D | RMB 42.3bn |
| Payment EBITDA margin | 28% |
| Top-merchant discounts | 10-40bps |
Same Document Delivered
Ant Group Porter's Five Forces Analysis
This preview shows the exact Ant Group Porter's Five Forces analysis you'll receive immediately after purchase-no placeholders, no mockups, fully formatted and ready for download and use.
Product Information
Product Information
Shipping & Returns
Shipping & Returns
Description
A Must-Have Tool for Decision-Makers
Ant Group faces intense rivalry from fintech incumbents and Big Tech, moderate supplier power but high regulatory and new-entrant threats, and buyer leverage driven by platform switching-this snapshot highlights strategic tensions and growth levers.
Unlock the full Porter's Five Forces Analysis to explore force-by-force ratings, visuals, and actionable insights tailored to Ant Group's competitive landscape.
Suppliers Bargaining Power
Concentrated Financial Institution Partnerships
Ant Group depends on ~100 partner banks and ~170 asset managers to underwrite loans and offer funds; in 2025 these partners provided ~¥1.2 trillion (~$165bn) of off‑balance liquidity, giving them strong leverage over Ant's CreditTech and wealth segments.
Dominance of State-Owned Entities
Key suppliers of regulatory legitimacy and infrastructure-state-owned banks and the People's Bank of China (PBOC)-hold decisive leverage over Ant Group after its 2020-25 restructuring into a financial holding company; Beijing's direct stakes and oversight mean the state acts as the ultimate supplier of operating rights.
This limits Ant's bargaining on data sharing and pricing: by end-2025 state entities held roughly 12-18% direct/indirect stakes and regulators imposed ceilings such as the PBOC-guided loan prime rate link and data residency rules.
As a result, Ant faces constrained autonomy on interest-rate-related products and mandatory data access terms, reducing its supplier-negotiation power and compressing potential margins.
Cloud and AI Infrastructure Costs
Ant Group's AI-native payments like Alipay AI Pay drive massive compute: in FY2025 Ant reported ~¥48.2 billion in R&D and cloud-related tech spend, forcing heavy use of advanced semiconductors and AI accelerators.
Global supply tightness and export controls give suppliers high bargaining power-NVIDIA's data-center GPU ASPs rose ~12% in 2025, and China-focused AI chip imports faced quotas, raising Ant's sourcing costs.
Ant's 2026 push into Agentic AI further concentrates demand on specialized chips and cloud tiers, increasing single-vendor risk and negotiating leverage for suppliers unless Ant invests in in-house silicon or multi-cloud diversification.
Talent Scarcity in Fintech and AI
Talent scarcity in AI and financial-security engineering gives top candidates strong bargaining power; Ant Group reported R&D spend of RMB 23.8 billion in FY2025, up 18% year-over-year, largely driven by hiring and retention costs.
Competing globally with Google and Tencent for niche AI talent during Ant Group's international push raises average total compensation by an estimated 20-30%, squeezing margins.
Higher pay and recruitment intensity force trade-offs: slower margin recovery or reallocating capital from other growth projects to talent retention.
- R&D spend FY2025: RMB 23.8bn
- Compensation uplift vs peers: +20-30%
- YOY R&D growth: +18%
Dependence on Global Payment Networks
Ant International relies on Visa and Mastercard for cross-border tap-to-pay reach; despite Alipay+ rollout, global networks control merchant rails and can set interchange fees and access terms that affect margins.
In 2025 Ant Group reported 1.5 billion annual active users globally, yet <0.5% of Western POS transactions use Alipay+, exposing dependence on incumbents.
- Visa/Mastercard control ~80% of global card rails
- Interchange fees can be 1-3% of transaction value
- Alipay+ needs network cooperation for Western merchant acceptance
Suppliers Drive Liquidity; State Holds 12-18% Influence as R&D, GPUs, Cards Gain
Suppliers wield high power: partner banks/asset managers supplied ~¥1.2T (~$165B) off‑balance liquidity in 2025; state (PBOC/state banks) held ~12-18% influence and regulatory levers; FY2025 R&D/cloud spend ¥48.2B (R&D ¥23.8B); NVIDIA GPU ASPs +12% in 2025; Visa/Mastercard ~80% rail share.
| Metric | 2025 value |
|---|---|
| Off‑balance liquidity | ¥1.2T (~$165B) |
| State stake/ influence | 12-18% |
| R&D spend | ¥23.8B |
| R&D+cloud spend | ¥48.2B |
| NVIDIA GPU ASP change | +12% |
| Visa/Mastercard rail share | ~80% |
What is included in the product
Detailed Word Document
Tailored Porter's Five Forces for Ant Group, highlighting competitive intensity, buyer/supplier leverage, barriers to entry, and threats from substitutes and fintech disruptors, with strategic implications for pricing, profitability, and market defense.
Customizable Excel Spreadsheet
A concise Porter's Five Forces snapshot for Ant Group-distills competitive pressures into a single page to speed strategic choices and boardroom decisions.
Customers Bargaining Power
Low Switching Costs for Consumers
The average Chinese consumer uses both Alipay and WeChat Pay, so switching costs are near zero; the 2024 PBOC survey showed 94% of urban users hold two or more e-wallets, pressuring Ant Group to retain users.
Regulatory 'unbundling' since 2021 ended product lock-in for lending and wealth management, and Ant's MYBank loans fell 18% YoY in 2025, showing user mobility.
This high mobility forces Ant Group to spend on UX and incentives-marketing and R&D rose to RMB 42.3 billion in FY2025-to reduce churn.
High Price Sensitivity in SME Lending
Ant serves 150 million merchants, ~90% SMEs - a 2025 lending book exposure of about $28 billion to SME segments, making borrowers highly price-sensitive to fees and rates.
2026 caps limiting consumer loan rates to 4× the loan prime rate strengthen SME bargaining power by compressing pricing flexibility and margin for Ant.
SMEs can switch to JD.com or Meituan quickly; Ant lost ~0.8 pp merchant engagement in 2025 where rival offers undercut financing costs.
Increased Financial Literacy and Choice
As digital finance matures, Chinese retail customers compare wealth yields and insurance premiums more narrowly; a 2025 Bain survey found 62% of users regularly use comparison tools, up from 41% in 2020, pressuring Ant Group to match returns and rates. Third-party aggregators now list products from Alipay and rivals side-by-side, eroding Ant's ecosystem lock-in and forcing price and yield competition. This transparency means Ant must prove superior net interest spreads and fee structures-Ant Group's 2025 consumer finance revenue of RMB 58.3 billion faces direct comparability against peers. If Ant's mutual fund average 1-year return lags market leaders by 0.5-1.0 percentage points, customer churn risk rises materially.
Bargaining Power of Large Merchants
Major retail chains and e-commerce platforms (e.g., Alibaba's Tmall, JD.com) negotiate fees with Ant Group; in 2025 top merchants processing >¥200bn annually can secure discounts cutting take-rate by 10-40bps, pressuring Ant's margins.
These mega-buyers can shift volume to rival wallets or closed-loop systems; Alibaba-owned ecosystem still accounted for ~45% of Ant's mainland China volumes in FY2025, so migration risk is meaningful.
Margin squeeze: Ant's payment processing EBITDA margin fell to ~28% in FY2025 vs 32% in FY2023, partly due to large-merchant discounts and promotional fee cuts.
- Top merchants (>¥200bn): 10-40bps discount
- Alibaba ecosystem: ~45% of volume (FY2025)
- EBITDA margin: 28% (FY2025) vs 32% (FY2023)
Collective Influence via Regulatory Protection
Regulatory consumer-protection reforms have turned customers into a collective bargaining force, with China's 2024 Anti-Monopoly and Consumer Protection updates capping data use and banning 'improper links' that favored Ant Group's lending partners.
Enforced app neutrality means users choose services by merit; Ant's 2025 digital-loan referrals fell ~28% YoY, shifting fee revenue and bargaining leverage to consumers.
- 2024 regs limit data reuse, reducing targeted push rates
- Ban on improper links cut Ant referral volume ~28% in 2025
- App neutrality raises switching rates, lowering platform lock-in
Ant Group margins squeezed as multi-wallet users, price-sensitive SMEs force cut to 28% EBITDA
Customers hold multiple e-wallets (94% 2024 PBOC), compare yields (62% use tools in 2025), and SMEs are price-sensitive (SME lending exposure ~$28bn FY2025), forcing Ant Group to cut take-rates (top merchants get 10-40bps) and invest RMB 42.3bn in marketing/R&D (FY2025), squeezing payment EBITDA to 28% (FY2025).
| Metric | Value (FY2025/2025) |
|---|---|
| Multi-wallet users | 94% (2024 PBOC) |
| User comparison tools | 62% (2025 Bain) |
| SME lending exposure | $28bn |
| Marketing & R&D | RMB 42.3bn |
| Payment EBITDA margin | 28% |
| Top-merchant discounts | 10-40bps |
Same Document Delivered
Ant Group Porter's Five Forces Analysis
This preview shows the exact Ant Group Porter's Five Forces analysis you'll receive immediately after purchase-no placeholders, no mockups, fully formatted and ready for download and use.


